| Analysis of “PAL_VMWare_View_Connection_Server_Performance.blg”Report Generated at: 9/25/2012 11:43:21 AM | PALv2 |
On This Page
- 9/25/2012 11:29:51 AM – 9/25/2012 11:30:06 AM Alerts: (3)
- 9/25/2012 11:30:06 AM – 9/25/2012 11:30:21 AM Alerts: (3)
- 9/25/2012 11:30:21 AM – 9/25/2012 11:30:36 AM Alerts: (4)
- 9/25/2012 11:30:36 AM – 9/25/2012 11:30:51 AM Alerts: (6)
- 9/25/2012 11:30:51 AM – 9/25/2012 11:31:06 AM Alerts: (4)
- 9/25/2012 11:31:06 AM – 9/25/2012 11:31:21 AM Alerts: (4)
- 9/25/2012 11:31:21 AM – 9/25/2012 11:31:36 AM Alerts: (4)
- 9/25/2012 11:31:36 AM – 9/25/2012 11:31:51 AM Alerts: (4)
- 9/25/2012 11:31:51 AM – 9/25/2012 11:32:06 AM Alerts: (4)
- 9/25/2012 11:32:06 AM – 9/25/2012 11:32:21 AM Alerts: (4)
- 9/25/2012 11:32:21 AM – 9/25/2012 11:32:36 AM Alerts: (4)
- 9/25/2012 11:32:36 AM – 9/25/2012 11:32:51 AM Alerts: (4)
- 9/25/2012 11:32:51 AM – 9/25/2012 11:33:06 AM Alerts: (4)
- 9/25/2012 11:33:06 AM – 9/25/2012 11:33:21 AM Alerts: (4)
- 9/25/2012 11:33:21 AM – 9/25/2012 11:33:36 AM Alerts: (4)
- 9/25/2012 11:33:36 AM – 9/25/2012 11:33:51 AM Alerts: (4)
- 9/25/2012 11:33:51 AM – 9/25/2012 11:33:59 AM Alerts: (4)
- Cache
- LogicalDisk % Free Space (Alerts: 0)
- LogicalDisk Read Latency Analysis (Alerts: 0)
- LogicalDisk Write Latency Analysis (Alerts: 0)
- LogicalDisk % Idle Time (Alerts: 0)
- LogicalDisk Disk Transfers/sec (Stats only)
- LogicalDisk Read/Write Ratio (Stats only)
- LogicalDisk Bytes/Read (Alerts: 0)
- LogicalDisk Bytes/Write (Alerts: 0)
- LogicalDisk Avg. Disk Queue Length (Alerts: 0)
- LogicalDisk Current Disk Queue Length (Alerts: 0)
- LogicalDisk Disk Bytes/sec (Stats only)
- LogicalDisk Free Megabytes (Alerts: 17)
- Memory
- Memory Available MBytes (Alerts: 0)
- Memory Free System Page Table Entries (Alerts: 0)
- Memory Pool Non-Paged Bytes (Alerts: 0)
- Memory Pool Paged Bytes (Alerts: 0)
- Memory Pages/sec (Alerts: 0)
- Memory System Cache Resident Bytes (Alerts: 0)
- Memory Cache Bytes (Alerts: 0)
- Memory % Committed Bytes In Use (Alerts: 0)
- Memory Pages Output/sec (Stats only)
- Memory Transition Pages RePurposed/sec (Stats only)
- Memory Committed Bytes (Stats only)
- Memory Commit Limit (Stats only)
- Memory Pages Input/sec (Alerts: 0)
- Memory Free & Zero Page List Bytes (Stats only)
- Network Interface
- Network Interface % Network Utilization (Alerts: 0)
- Network Interface Output Queue Length (Alerts: 0)
- Network Interface % Network Utilization Sent (Alerts: 0)
- Network Interface % Network Utilization Received (Alerts: 0)
- Network Interface Packets Outbound Errors (Alerts: 0)
- Network Interface Bytes Total/sec (Stats only)
- Network Interface Current Bandwidth (Stats only)
- Network Interface Packets/sec (Stats only)
- Network Interface Packets Sent/sec (Stats only)
- Network Interface Packets Received/sec (Stats only)
- Paging File
- PhysicalDisk Read Latency Analysis (Alerts: 0)
- PhysicalDisk Write Latency Analysis (Alerts: 0)
- PhysicalDisk Current Disk Queue Length (Alerts: 0)
- PhysicalDisk Avg. Disk Queue Length (Alerts: 0)
- PhysicalDisk Disk Bytes/sec (Stats only)
- PhysicalDisk Calculated IOPS (Stats only)
- Process
- Process Private Bytes (Alerts: 0)
- Process Handle Count (Alerts: 1)
- Process Thread Count (Alerts: 0)
- Process Working Set (Alerts: 1)
- Process % Processor Time (Stats only)
- Process Virtual Bytes (Alerts: 34)
- Process IO Data Operations/sec (Alerts: 0)
- Process IO Other Operations/sec (Alerts: 0)
- Process ID Process (Stats only)
- Process IO Read Operations/sec (Stats only)
- Process IO Write Operations/sec (Stats only)
- Process % Privileged Time (Stats only)
- Processor
- Processor % Processor Time (Alerts: 0)
- Processor % Privileged Time (Alerts: 0)
- Processor % Interrupt Time (Alerts: 0)
- Processor % DPC Time (Alerts: 0)
- Processor % User Time (Stats only)
- Processor DPC Rate (Stats only)
- Processor Information
- Processor Information Parking Status (Stats only)
- Processor Information % of Maximum Frequency (Stats only)
- Server
- System Processor Queue Length (Alerts: 0)
- System High Context Switching (Alerts: 0)
- System System Calls/sec (Stats only)
- TCPv4
- Memory Active in MB (Stats only)
- Memory Ballooned in MB (Stats only)
- Memory Limit in MB (Stats only)
- Memory Mapped in MB (Stats only)
- Memory Overhead in MB (Stats only)
- Memory Reservation in MB (Stats only)
- Memory Shared in MB (Stats only)
- Memory Shared Saved in MB (Stats only)
- Memory Shares (Stats only)
- Memory Swapped in MB (Stats only)
- Memory Used in MB (Stats only)
- VM Processor
- Limit in MHz (Stats only)
- Reservation in MHz (Stats only)
- Shares (Stats only)
- CPU stolen time (Stats only)
- % Processor Time (Stats only)
- Effective VM Speed in MHz (Stats only)
- Host processor speed in MHz (Stats only)
- Vmware View Connection Server
- All Sessions (Stats only)
- All Sessions High (Stats only)
- Full VM Sessions (Stats only)
- Full VM Sessions High (Stats only)
- Linked Clone Sessions (Stats only)
- Linked Clone Sessions High (Stats only)
- Other Sessions (Stats only)
- Other Sessions High (Stats only)
- PCoIP Gateway Sessions (Stats only)
- PCoIP Gateway Sessions High (Stats only)
- Secure Gateway Sessions (Stats only)
- Secure Gateway Sessions High (Stats only)
- VMware View Connection Server
- All Sessions (Stats only)
- All Sessions High (Stats only)
- Full VM Sessions (Stats only)
- Full VM Sessions High (Stats only)
- Linked Clone Sessions (Stats only)
- Linked Clone Sessions High (Stats only)
- Other Sessions (Stats only)
- Other Sessions High (Stats only)
- PCoIP Gateway Sessions (Stats only)
- PCoIP Gateway Sessions High (Stats only)
- Secure Gateway Sessions (Stats only)
- Secure Gateway Sessions High (Stats only)
- Disclaimer
Tool Parameters: |
| Name | Value |
|---|---|
| Log Time Range: | 9/25/2012 11:29:51 AM – 9/25/2012 11:34:06 AM |
| Log(s): | C:Usersjosh.townsendDesktopPAL_VMWare_View_Connection_Server_Performance.blg |
| AnalysisInterval: | 8 second(s) |
| Threshold File: | C:Program FilesPALPALPAL_VMwareView_VDM.xml |
| AllCounterStats: | False |
| NumberOfProcessors: | 4 |
| vRAMSize: | 2 |
| ViewParentSixtyFourBit: | False |
| LinnkedClone: | True |
| SixtyFourBit: | False |
| NumberOfVirtualCPUs: | 1 |
| TotalMemory: | 4 |
| RAID5Drives: | NULL |
| RAID1Drives: | NULL |
| ThreeGBSwitch: | False |
Alerts by Chronological Order |
Description: This section displays all of the alerts in chronological order.
Alerts
| An alert is generated if any of the thresholds were broken during one of the time ranges analyzed. The background of each of the values represents the highest priority threshold that the value broke. See each of the counter’s respective analysis section for more details about what the threshold means. |
| Time Range | ||||||
|---|---|---|---|---|---|---|
| 9/25/2012 11:29:51 AM – 9/25/2012 11:30:06 AM | Condition | Counter | Min | Avg | Max | Hourly Trend |
| Greater than 75 percent of estimated process virtual address space | VIEWCS1Process(ViewTopoSvc)Virtual Bytes | 2,939,367,424 | 2,939,367,424 | 2,939,367,424 | 0 | |
| Greater than 75 percent of estimated process virtual address space | VIEWCS1Process(ws_TomcatService)Virtual Bytes | 1,620,615,168 | 1,620,615,168 | 1,620,615,168 | 0 | |
| Less than 500 MB of free disk space | VIEWCS1LogicalDisk(HarddiskVolume1)Free Megabytes | 71 | 71 | 71 | 0 | |
| 9/25/2012 11:30:06 AM – 9/25/2012 11:30:21 AM | Condition | Counter | Min | Avg | Max | Hourly Trend |
| Greater than 75 percent of estimated process virtual address space | VIEWCS1Process(ViewTopoSvc)Virtual Bytes | 2,939,367,424 | 2,939,367,424 | 2,939,367,424 | 0 | |
| Greater than 75 percent of estimated process virtual address space | VIEWCS1Process(ws_TomcatService)Virtual Bytes | 1,618,518,016 | 1,618,518,016 | 1,618,518,016 | -943,718,400 | |
| Less than 500 MB of free disk space | VIEWCS1LogicalDisk(HarddiskVolume1)Free Megabytes | 71 | 71 | 71 | 0 | |
| 9/25/2012 11:30:21 AM – 9/25/2012 11:30:36 AM | Condition | Counter | Min | Avg | Max | Hourly Trend |
| Greater than 75 percent of estimated process virtual address space | VIEWCS1Process(ViewTopoSvc)Virtual Bytes | 2,939,367,424 | 2,939,367,424 | 2,939,367,424 | 0 | |
| Greater than 75 percent of estimated process virtual address space | VIEWCS1Process(ws_TomcatService)Virtual Bytes | 1,618,518,016 | 1,618,518,016 | 1,618,518,016 | -471,859,200 | |
| Less than 500 MB of free disk space | VIEWCS1LogicalDisk(HarddiskVolume1)Free Megabytes | 71 | 71 | 71 | 0 | |
| More than 10 TCP connection failures per hour | VIEWCS1TCPv4Connection Failures | 631 | 631 | 631 | 225 | |
| 9/25/2012 11:30:36 AM – 9/25/2012 11:30:51 AM | Condition | Counter | Min | Avg | Max | Hourly Trend |
| Possible Handle Leak: More than 500 handles between overall Min and overall Max and an increasing trend of more than 500 handles per hour | VIEWCS1Process(_Total)Handle Count | 22,058 | 22,058 | 22,058 | 16,200 | |
| The working set of all processes combined is increasing at a rate greater than 100MBs per hour | VIEWCS1Process(_Total)Working Set | 1,671,376,896 | 1,671,376,896 | 1,671,376,896 | 556,646,400 | |
| Greater than 75 percent of estimated process virtual address space | VIEWCS1Process(ViewTopoSvc)Virtual Bytes | 2,943,561,728 | 2,943,561,728 | 2,943,561,728 | 629,145,600 | |
| Greater than 75 percent of estimated process virtual address space | VIEWCS1Process(ws_TomcatService)Virtual Bytes | 1,619,566,592 | 1,619,566,592 | 1,619,566,592 | -157,286,400 | |
| Less than 500 MB of free disk space | VIEWCS1LogicalDisk(HarddiskVolume1)Free Megabytes | 71 | 71 | 71 | 0 | |
| More than 10 TCP connection failures per hour | VIEWCS1TCPv4Connection Failures | 631 | 631 | 631 | 150 | |
| 9/25/2012 11:30:51 AM – 9/25/2012 11:31:06 AM | Condition | Counter | Min | Avg | Max | Hourly Trend |
| Greater than 75 percent of estimated process virtual address space | VIEWCS1Process(ViewTopoSvc)Virtual Bytes | 2,943,561,728 | 2,943,561,728 | 2,943,561,728 | 471,859,200 | |
| Greater than 75 percent of estimated process virtual address space | VIEWCS1Process(ws_TomcatService)Virtual Bytes | 1,619,566,592 | 1,619,566,592 | 1,619,566,592 | -117,964,800 | |
| Less than 500 MB of free disk space | VIEWCS1LogicalDisk(HarddiskVolume1)Free Megabytes | 71 | 71 | 71 | 0 | |
| More than 10 TCP connection failures per hour | VIEWCS1TCPv4Connection Failures | 631 | 631 | 631 | 112 | |
| 9/25/2012 11:31:06 AM – 9/25/2012 11:31:21 AM | Condition | Counter | Min | Avg | Max | Hourly Trend |
| Greater than 75 percent of estimated process virtual address space | VIEWCS1Process(ViewTopoSvc)Virtual Bytes | 2,943,561,728 | 2,943,561,728 | 2,943,561,728 | 377,487,360 | |
| Greater than 75 percent of estimated process virtual address space | VIEWCS1Process(ws_TomcatService)Virtual Bytes | 1,619,566,592 | 1,619,566,592 | 1,619,566,592 | -94,371,840 | |
| Less than 500 MB of free disk space | VIEWCS1LogicalDisk(HarddiskVolume1)Free Megabytes | 71 | 71 | 71 | 0 | |
| More than 10 TCP connection failures per hour | VIEWCS1TCPv4Connection Failures | 631 | 631 | 631 | 90 | |
| 9/25/2012 11:31:21 AM – 9/25/2012 11:31:36 AM | Condition | Counter | Min | Avg | Max | Hourly Trend |
| Greater than 75 percent of estimated process virtual address space | VIEWCS1Process(ViewTopoSvc)Virtual Bytes | 2,943,561,728 | 2,943,561,728 | 2,943,561,728 | 314,572,800 | |
| Greater than 75 percent of estimated process virtual address space | VIEWCS1Process(ws_TomcatService)Virtual Bytes | 1,619,566,592 | 1,619,566,592 | 1,619,566,592 | -78,643,200 | |
| Less than 500 MB of free disk space | VIEWCS1LogicalDisk(HarddiskVolume1)Free Megabytes | 71 | 71 | 71 | 0 | |
| More than 10 TCP connection failures per hour | VIEWCS1TCPv4Connection Failures | 631 | 631 | 631 | 75 | |
| 9/25/2012 11:31:36 AM – 9/25/2012 11:31:51 AM | Condition | Counter | Min | Avg | Max | Hourly Trend |
| Greater than 75 percent of estimated process virtual address space | VIEWCS1Process(ViewTopoSvc)Virtual Bytes | 2,943,561,728 | 2,943,561,728 | 2,943,561,728 | 269,633,829 | |
| Greater than 75 percent of estimated process virtual address space | VIEWCS1Process(ws_TomcatService)Virtual Bytes | 1,617,469,440 | 1,617,469,440 | 1,617,469,440 | -202,225,371 | |
| Less than 500 MB of free disk space | VIEWCS1LogicalDisk(HarddiskVolume1)Free Megabytes | 71 | 71 | 71 | 0 | |
| More than 10 TCP connection failures per hour | VIEWCS1TCPv4Connection Failures | 631 | 631 | 631 | 64 | |
| 9/25/2012 11:31:51 AM – 9/25/2012 11:32:06 AM | Condition | Counter | Min | Avg | Max | Hourly Trend |
| Greater than 75 percent of estimated process virtual address space | VIEWCS1Process(ViewTopoSvc)Virtual Bytes | 2,941,464,576 | 2,941,464,576 | 2,941,464,576 | 117,964,800 | |
| Greater than 75 percent of estimated process virtual address space | VIEWCS1Process(ws_TomcatService)Virtual Bytes | 1,617,469,440 | 1,617,469,440 | 1,617,469,440 | -176,947,200 | |
| Less than 500 MB of free disk space | VIEWCS1LogicalDisk(HarddiskVolume1)Free Megabytes | 71 | 71 | 71 | 0 | |
| More than 10 TCP connection failures per hour | VIEWCS1TCPv4Connection Failures | 632 | 632 | 632 | 112 | |
| 9/25/2012 11:32:06 AM – 9/25/2012 11:32:21 AM | Condition | Counter | Min | Avg | Max | Hourly Trend |
| Greater than 75 percent of estimated process virtual address space | VIEWCS1Process(ViewTopoSvc)Virtual Bytes | 2,942,513,152 | 2,942,513,152 | 2,942,513,152 | 157,286,400 | |
| Greater than 75 percent of estimated process virtual address space | VIEWCS1Process(ws_TomcatService)Virtual Bytes | 1,619,566,592 | 1,619,566,592 | 1,619,566,592 | -52,428,800 | |
| Less than 500 MB of free disk space | VIEWCS1LogicalDisk(HarddiskVolume1)Free Megabytes | 71 | 71 | 71 | 0 | |
| More than 10 TCP connection failures per hour | VIEWCS1TCPv4Connection Failures | 632 | 632 | 632 | 100 | |
| 9/25/2012 11:32:21 AM – 9/25/2012 11:32:36 AM | Condition | Counter | Min | Avg | Max | Hourly Trend |
| Greater than 75 percent of estimated process virtual address space | VIEWCS1Process(ViewTopoSvc)Virtual Bytes | 2,942,513,152 | 2,942,513,152 | 2,942,513,152 | 141,557,760 | |
| Greater than 75 percent of estimated process virtual address space | VIEWCS1Process(ws_TomcatService)Virtual Bytes | 1,619,566,592 | 1,619,566,592 | 1,619,566,592 | -47,185,920 | |
| Less than 500 MB of free disk space | VIEWCS1LogicalDisk(HarddiskVolume1)Free Megabytes | 71 | 71 | 71 | 0 | |
| More than 10 TCP connection failures per hour | VIEWCS1TCPv4Connection Failures | 632 | 632 | 632 | 90 | |
| 9/25/2012 11:32:36 AM – 9/25/2012 11:32:51 AM | Condition | Counter | Min | Avg | Max | Hourly Trend |
| Greater than 75 percent of estimated process virtual address space | VIEWCS1Process(ViewTopoSvc)Virtual Bytes | 2,941,464,576 | 2,941,464,576 | 2,941,464,576 | 85,792,582 | |
| Greater than 75 percent of estimated process virtual address space | VIEWCS1Process(ws_TomcatService)Virtual Bytes | 1,619,566,592 | 1,619,566,592 | 1,619,566,592 | -42,896,291 | |
| Less than 500 MB of free disk space | VIEWCS1LogicalDisk(HarddiskVolume1)Free Megabytes | 71 | 71 | 71 | 0 | |
| More than 10 TCP connection failures per hour | VIEWCS1TCPv4Connection Failures | 632 | 632 | 632 | 82 | |
| 9/25/2012 11:32:51 AM – 9/25/2012 11:33:06 AM | Condition | Counter | Min | Avg | Max | Hourly Trend |
| Greater than 75 percent of estimated process virtual address space | VIEWCS1Process(ViewTopoSvc)Virtual Bytes | 2,939,367,424 | 2,939,367,424 | 2,939,367,424 | 0 | |
| Greater than 75 percent of estimated process virtual address space | VIEWCS1Process(ws_TomcatService)Virtual Bytes | 1,616,420,864 | 1,616,420,864 | 1,616,420,864 | -157,286,400 | |
| Less than 500 MB of free disk space | VIEWCS1LogicalDisk(HarddiskVolume1)Free Megabytes | 71 | 71 | 71 | 0 | |
| More than 10 TCP connection failures per hour | VIEWCS1TCPv4Connection Failures | 632 | 632 | 632 | 75 | |
| 9/25/2012 11:33:06 AM – 9/25/2012 11:33:21 AM | Condition | Counter | Min | Avg | Max | Hourly Trend |
| Greater than 75 percent of estimated process virtual address space | VIEWCS1Process(ViewTopoSvc)Virtual Bytes | 2,939,367,424 | 2,939,367,424 | 2,939,367,424 | 0 | |
| Greater than 75 percent of estimated process virtual address space | VIEWCS1Process(ws_TomcatService)Virtual Bytes | 1,614,323,712 | 1,614,323,712 | 1,614,323,712 | -217,781,169 | |
| Less than 500 MB of free disk space | VIEWCS1LogicalDisk(HarddiskVolume1)Free Megabytes | 71 | 71 | 71 | 0 | |
| More than 10 TCP connection failures per hour | VIEWCS1TCPv4Connection Failures | 633 | 633 | 633 | 104 | |
| 9/25/2012 11:33:21 AM – 9/25/2012 11:33:36 AM | Condition | Counter | Min | Avg | Max | Hourly Trend |
| Greater than 75 percent of estimated process virtual address space | VIEWCS1Process(ViewTopoSvc)Virtual Bytes | 2,937,270,272 | 2,937,270,272 | 2,937,270,272 | -67,408,457 | |
| Greater than 75 percent of estimated process virtual address space | VIEWCS1Process(ws_TomcatService)Virtual Bytes | 1,614,323,712 | 1,614,323,712 | 1,614,323,712 | -202,225,371 | |
| Less than 500 MB of free disk space | VIEWCS1LogicalDisk(HarddiskVolume1)Free Megabytes | 71 | 71 | 71 | 0 | |
| More than 10 TCP connection failures per hour | VIEWCS1TCPv4Connection Failures | 633 | 633 | 633 | 96 | |
| 9/25/2012 11:33:36 AM – 9/25/2012 11:33:51 AM | Condition | Counter | Min | Avg | Max | Hourly Trend |
| Greater than 75 percent of estimated process virtual address space | VIEWCS1Process(ViewTopoSvc)Virtual Bytes | 2,939,367,424 | 2,939,367,424 | 2,939,367,424 | 0 | |
| Greater than 75 percent of estimated process virtual address space | VIEWCS1Process(ws_TomcatService)Virtual Bytes | 1,616,420,864 | 1,616,420,864 | 1,616,420,864 | -125,829,120 | |
| Less than 500 MB of free disk space | VIEWCS1LogicalDisk(HarddiskVolume1)Free Megabytes | 71 | 71 | 71 | 0 | |
| More than 10 TCP connection failures per hour | VIEWCS1TCPv4Connection Failures | 633 | 633 | 633 | 90 | |
| 9/25/2012 11:33:51 AM – 9/25/2012 11:33:59 AM | Condition | Counter | Min | Avg | Max | Hourly Trend |
| Greater than 75 percent of estimated process virtual address space | VIEWCS1Process(ViewTopoSvc)Virtual Bytes | 2,938,318,848 | 2,938,318,848 | 2,938,318,848 | -29,491,200 | |
| Greater than 75 percent of estimated process virtual address space | VIEWCS1Process(ws_TomcatService)Virtual Bytes | 1,625,858,048 | 1,625,858,048 | 1,625,858,048 | 147,456,000 | |
| Less than 500 MB of free disk space | VIEWCS1LogicalDisk(HarddiskVolume1)Free Megabytes | 71 | 71 | 71 | 0 | |
| More than 10 TCP connection failures per hour | VIEWCS1TCPv4Connection Failures | 633 | 633 | 633 | 84 |
Cache |
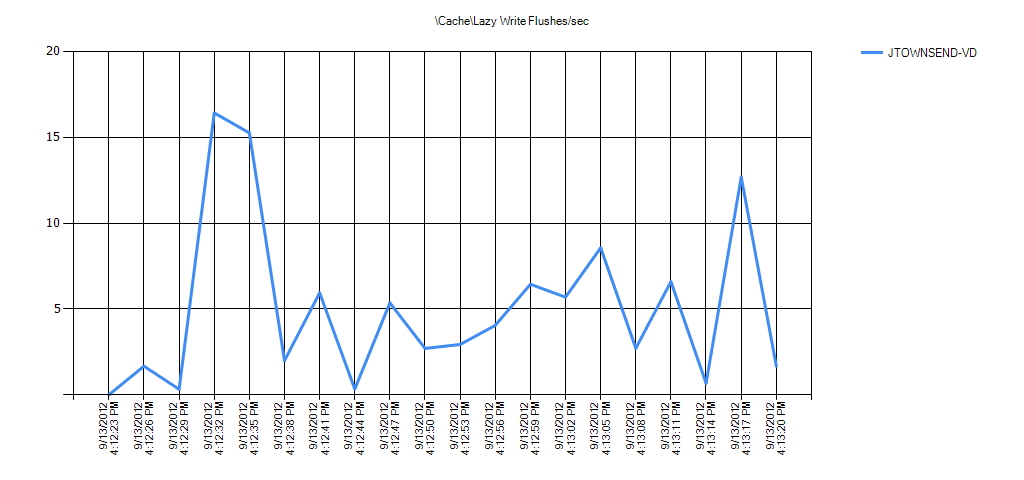
Cache Lazy Write Flushes/sec
Description: Lazy Write Flushes/sec is the rate at which the Lazy Writer thread has written to disk. Lazy Writing is the process of updating the disk after the page has been changed in memory, so that the application that changed the file does not have to wait for the disk write to be complete before proceeding. More than one page can be transferred by each write operation.
The lazy writer writes 20% of the dirty pages every second, but increases the number of lazy write flushes if it is unable to keep up with the rate of dirty pages.
This analysis checks for more than 100 lazy write flushes/second which might indicate that the lazy writer is falling behind in writing to the disk.
Overall Counter Instance Statistics
| Overall statistics of each of the counter instances. Min, Avg, and Max are the minimum, average, and Maximum values in the entire log. Hourly Trend is the calculated hourly slope of the entire log. 10%, 20%, and 30% of Outliers Removed is the average of the values after the percentage of outliers furthest away from the average have been removed. This is to help determine if a small percentage of the values are extreme which can skew the average. |
| Condition | CacheLazy Write Flushes/sec | Min | Avg | Max | Hourly Trend | Std Deviation | 10% of Outliers Removed | 20% of Outliers Removed | 30% of Outliers Removed |
|---|---|---|---|---|---|---|---|---|---|
| OK | VIEWCS1 | 1 | 2 | 3 | 0 | 1 | 2 | 2 | 2 |
Alerts
| An alert is generated if any of the thresholds were broken during one of the time ranges analyzed. The background of each of the values represents the highest priority threshold that the value broke. See each of the counter’s respective analysis section for more details about what the threshold means. |
| No Alerts Found |
|---|
Cache Dirty Pages
Description: Total number of dirty pages on the system cache

Overall Counter Instance Statistics
| Overall statistics of each of the counter instances. Min, Avg, and Max are the minimum, average, and Maximum values in the entire log. Hourly Trend is the calculated hourly slope of the entire log. 10%, 20%, and 30% of Outliers Removed is the average of the values after the percentage of outliers furthest away from the average have been removed. This is to help determine if a small percentage of the values are extreme which can skew the average. |
| Condition | CacheDirty Pages | Min | Avg | Max | Hourly Trend | Std Deviation | 10% of Outliers Removed | 20% of Outliers Removed | 30% of Outliers Removed |
|---|---|---|---|---|---|---|---|---|---|
| No Thresholds | VIEWCS1 | 33 | 54 | 77 | -703 | 12 | 52 | 49 | 48 |
Alerts
| An alert is generated if any of the thresholds were broken during one of the time ranges analyzed. The background of each of the values represents the highest priority threshold that the value broke. See each of the counter’s respective analysis section for more details about what the threshold means. |
| No Alerts Found |
|---|
LogicalDisk |
LogicalDisk % Free Space
Description: % Free Space is the percentage of total usable space on the selected logical disk drive that was free. Low to no free disk space can cause severe disk performance problems.This analysis checks for less than 10% free disk space (Warning alert) and less than 5% free disk space (Critical alert).

Overall Counter Instance Statistics
| Overall statistics of each of the counter instances. Min, Avg, and Max are the minimum, average, and Maximum values in the entire log. Hourly Trend is the calculated hourly slope of the entire log. 10%, 20%, and 30% of Outliers Removed is the average of the values after the percentage of outliers furthest away from the average have been removed. This is to help determine if a small percentage of the values are extreme which can skew the average. |
| Condition | LogicalDisk(*)% Free Space | Min | Avg | Max | Hourly Trend | Std Deviation | 10% of Outliers Removed | 20% of Outliers Removed | 30% of Outliers Removed |
|---|---|---|---|---|---|---|---|---|---|
| OK | VIEWCS1/C: | 44 | 44 | 44 | 0 | 0 | 44 | 44 | 44 |
| OK | VIEWCS1/HarddiskVolume1 | 72 | 72 | 72 | 0 | 0 | 72 | 72 | 72 |
Alerts
| An alert is generated if any of the thresholds were broken during one of the time ranges analyzed. The background of each of the values represents the highest priority threshold that the value broke. See each of the counter’s respective analysis section for more details about what the threshold means. |
| No Alerts Found |
|---|
LogicalDisk Read Latency Analysis
Description: Avg. Disk sec/Read is the average time, in seconds, of a read of data to the disk. This analysis determines if any of the physical disks are responding slowly.
If the response times are less than .015 (15 milliseconds), then the disk subsystem is keeping up with demand, but does not have much overhead left.
If the response times are greater than .025 (25 milliseconds), then noticeable slow downs and performance issues affecting users may be occurring.
Reference:
Ruling Out Disk-Bound Problems
https://technet.microsoft.com/en-us/library/5bcdd349-dcc6-43eb-9dc3-54175f7061ad.aspx

Overall Counter Instance Statistics
| Overall statistics of each of the counter instances. Min, Avg, and Max are the minimum, average, and Maximum values in the entire log. Hourly Trend is the calculated hourly slope of the entire log. 10%, 20%, and 30% of Outliers Removed is the average of the values after the percentage of outliers furthest away from the average have been removed. This is to help determine if a small percentage of the values are extreme which can skew the average. |
| Condition | LogicalDisk(*)Avg. Disk sec/Read | Min | Avg | Max | Hourly Trend | Std Deviation | 10% of Outliers Removed | 20% of Outliers Removed | 30% of Outliers Removed |
|---|---|---|---|---|---|---|---|---|---|
| OK | VIEWCS1/C: | 0 | 0 | 0 | 0 | 0 | 0 | 0 | 0 |
| OK | VIEWCS1/HarddiskVolume1 | 0 | 0 | 0 | 0 | 0 | 0 | 0 | 0 |
Alerts
| An alert is generated if any of the thresholds were broken during one of the time ranges analyzed. The background of each of the values represents the highest priority threshold that the value broke. See each of the counter’s respective analysis section for more details about what the threshold means. |
| No Alerts Found |
|---|
LogicalDisk Write Latency Analysis
Description: Avg. Disk sec/Write is the average time, in seconds, of a write of data to the disk. This analysis determines if any of the physical disks are responding slowly.
If the response times are greater than .015 (15 milliseconds), then the disk subsystem is keeping up with demand, but does not have much overhead left.
If the response times are greater than .025 (25 milliseconds), then noticeable slow downs and performance issues affecting users may be occurring.
Reference:
Ruling Out Disk-Bound Problems
https://technet.microsoft.com/en-us/library/5bcdd349-dcc6-43eb-9dc3-54175f7061ad.aspx

Overall Counter Instance Statistics
| Overall statistics of each of the counter instances. Min, Avg, and Max are the minimum, average, and Maximum values in the entire log. Hourly Trend is the calculated hourly slope of the entire log. 10%, 20%, and 30% of Outliers Removed is the average of the values after the percentage of outliers furthest away from the average have been removed. This is to help determine if a small percentage of the values are extreme which can skew the average. |
| Condition | LogicalDisk(*)Avg. Disk sec/Write | Min | Avg | Max | Hourly Trend | Std Deviation | 10% of Outliers Removed | 20% of Outliers Removed | 30% of Outliers Removed |
|---|---|---|---|---|---|---|---|---|---|
| OK | VIEWCS1/C: | .001 | .001 | .001 | 0 | 0 | .001 | .001 | .001 |
| OK | VIEWCS1/HarddiskVolume1 | 0 | 0 | 0 | 0 | 0 | 0 | 0 | 0 |
Alerts
| An alert is generated if any of the thresholds were broken during one of the time ranges analyzed. The background of each of the values represents the highest priority threshold that the value broke. See each of the counter’s respective analysis section for more details about what the threshold means. |
| No Alerts Found |
|---|
LogicalDisk % Idle Time
Description: % Idle Time reports the percentage of time during the sample interval that the disk was idle.
This analysis checks for a % Idle Time of less than 10. Zero (0) indicates that the disk contstanly has at least 1 outstanding I/O in the queue.
Reference:
Overall Counter Instance Statistics
| Overall statistics of each of the counter instances. Min, Avg, and Max are the minimum, average, and Maximum values in the entire log. Hourly Trend is the calculated hourly slope of the entire log. 10%, 20%, and 30% of Outliers Removed is the average of the values after the percentage of outliers furthest away from the average have been removed. This is to help determine if a small percentage of the values are extreme which can skew the average. |
| Condition | LogicalDisk(*)% Idle Time | Min | Avg | Max | Hourly Trend | Std Deviation | 10% of Outliers Removed | 20% of Outliers Removed | 30% of Outliers Removed |
|---|---|---|---|---|---|---|---|---|---|
| OK | VIEWCS1/C: | 99 | 100 | 100 | 0 | 0 | 100 | 100 | 100 |
| OK | VIEWCS1/HarddiskVolume1 | 100 | 100 | 100 | 0 | 0 | 100 | 100 | 100 |
Alerts
| An alert is generated if any of the thresholds were broken during one of the time ranges analyzed. The background of each of the values represents the highest priority threshold that the value broke. See each of the counter’s respective analysis section for more details about what the threshold means. |
| No Alerts Found |
|---|
LogicalDisk Disk Transfers/sec
Description: Disk Transfers/sec is the rate of read and write operations on the disk.

Overall Counter Instance Statistics
| Overall statistics of each of the counter instances. Min, Avg, and Max are the minimum, average, and Maximum values in the entire log. Hourly Trend is the calculated hourly slope of the entire log. 10%, 20%, and 30% of Outliers Removed is the average of the values after the percentage of outliers furthest away from the average have been removed. This is to help determine if a small percentage of the values are extreme which can skew the average. |
| Condition | LogicalDisk(*)Disk Transfers/sec | Min | Avg | Max | Hourly Trend | Std Deviation | 10% of Outliers Removed | 20% of Outliers Removed | 30% of Outliers Removed |
|---|---|---|---|---|---|---|---|---|---|
| No Thresholds | VIEWCS1/C: | 2 | 4 | 9 | -84 | 2 | 4 | 3 | 3 |
| No Thresholds | VIEWCS1/HarddiskVolume1 | 0 | 0 | 0 | 0 | 0 | 0 | 0 | 0 |
Alerts
| An alert is generated if any of the thresholds were broken during one of the time ranges analyzed. The background of each of the values represents the highest priority threshold that the value broke. See each of the counter’s respective analysis section for more details about what the threshold means. |
| No Alerts Found |
|---|
LogicalDisk Read/Write Ratio
Description:
This analysis shows the ratio of reads to writes for each logical disk. For example, a value of 25 means 25 percent of all of the I/O per second is read I/O and 75 percent is write I/O.


Overall Counter Instance Statistics
| Overall statistics of each of the counter instances. Min, Avg, and Max are the minimum, average, and Maximum values in the entire log. Hourly Trend is the calculated hourly slope of the entire log. 10%, 20%, and 30% of Outliers Removed is the average of the values after the percentage of outliers furthest away from the average have been removed. This is to help determine if a small percentage of the values are extreme which can skew the average. |
| Condition | LogicalDisk(*)Read Write Ratio | Min | Avg | Max | Hourly Trend | Std Deviation | 10% of Outliers Removed | 20% of Outliers Removed | 30% of Outliers Removed |
|---|---|---|---|---|---|---|---|---|---|
| No Thresholds | VIEWCS1/HarddiskVolume1 | 0 | 0 | 0 | 0 | 0 | 0 | 0 | 0 |
| No Thresholds | VIEWCS1/C: | 0 | 1 | 22 | 0 | 5 | 0 | 0 | 0 |
| Condition | LogicalDisk(*)Disk Reads/sec | Min | Avg | Max | Hourly Trend | Std Deviation | 10% of Outliers Removed | 20% of Outliers Removed | 30% of Outliers Removed |
|---|---|---|---|---|---|---|---|---|---|
| No Thresholds | VIEWCS1/C: | 0 | 0 | 2 | 0 | 1 | 0 | 0 | 0 |
| No Thresholds | VIEWCS1/HarddiskVolume1 | 0 | 0 | 0 | 0 | 0 | 0 | 0 | 0 |
| Condition | LogicalDisk(*)Disk Writes/sec | Min | Avg | Max | Hourly Trend | Std Deviation | 10% of Outliers Removed | 20% of Outliers Removed | 30% of Outliers Removed |
|---|---|---|---|---|---|---|---|---|---|
| No Thresholds | VIEWCS1/C: | 2 | 4 | 7 | -84 | 1 | 4 | 3 | 3 |
| No Thresholds | VIEWCS1/HarddiskVolume1 | 0 | 0 | 0 | 0 | 0 | 0 | 0 | 0 |
Alerts
| An alert is generated if any of the thresholds were broken during one of the time ranges analyzed. The background of each of the values represents the highest priority threshold that the value broke. See each of the counter’s respective analysis section for more details about what the threshold means. |
| No Alerts Found |
|---|
LogicalDisk Bytes/Read
Description: This analysis shows the size of logical disk reads per second. The size of an I/O request packets (IRP) can have a direct affect on the average response times from the disk. This analysis checks for I/O request sizes of 64 KB or larger. Correlate this analysis with the Avg. Disk Sec/Read and Avg. Disk Sec/Write analyses.
References:

Overall Counter Instance Statistics
| Overall statistics of each of the counter instances. Min, Avg, and Max are the minimum, average, and Maximum values in the entire log. Hourly Trend is the calculated hourly slope of the entire log. 10%, 20%, and 30% of Outliers Removed is the average of the values after the percentage of outliers furthest away from the average have been removed. This is to help determine if a small percentage of the values are extreme which can skew the average. |
| Condition | LogicalDisk(*)Avg. Disk Bytes/Read | Min | Avg | Max | Hourly Trend | Std Deviation | 10% of Outliers Removed | 20% of Outliers Removed | 30% of Outliers Removed |
|---|---|---|---|---|---|---|---|---|---|
| OK | VIEWCS1/C: | 0 | 2,434 | 41,376 | 0 | 10,035 | 0 | 0 | 0 |
| OK | VIEWCS1/HarddiskVolume1 | 0 | 0 | 0 | 0 | 0 | 0 | 0 | 0 |
Alerts
| An alert is generated if any of the thresholds were broken during one of the time ranges analyzed. The background of each of the values represents the highest priority threshold that the value broke. See each of the counter’s respective analysis section for more details about what the threshold means. |
| No Alerts Found |
|---|
LogicalDisk Bytes/Write
Description: This analysis shows the size of logical disk writes per second. The size of an I/O request packets (IRP) can have a direct affect on the average response times from the disk. This analysis checks for I/O request sizes of 64 KB or larger. Correlate this analysis with the Avg. Disk Sec/Read and Avg. Disk Sec/Write analyses.
Reference:

Overall Counter Instance Statistics
| Overall statistics of each of the counter instances. Min, Avg, and Max are the minimum, average, and Maximum values in the entire log. Hourly Trend is the calculated hourly slope of the entire log. 10%, 20%, and 30% of Outliers Removed is the average of the values after the percentage of outliers furthest away from the average have been removed. This is to help determine if a small percentage of the values are extreme which can skew the average. |
| Condition | LogicalDisk(*)Avg. Disk Bytes/Write | Min | Avg | Max | Hourly Trend | Std Deviation | 10% of Outliers Removed | 20% of Outliers Removed | 30% of Outliers Removed |
|---|---|---|---|---|---|---|---|---|---|
| OK | VIEWCS1/C: | 4,096 | 5,924 | 8,252 | 63,253 | 1,123 | 5,652 | 5,563 | 5,400 |
| OK | VIEWCS1/HarddiskVolume1 | 0 | 0 | 0 | 0 | 0 | 0 | 0 | 0 |
Alerts
| An alert is generated if any of the thresholds were broken during one of the time ranges analyzed. The background of each of the values represents the highest priority threshold that the value broke. See each of the counter’s respective analysis section for more details about what the threshold means. |
| No Alerts Found |
|---|
LogicalDisk Avg. Disk Queue Length
Description: Avg. Disk Queue Length is the average number of both read and write requests that were queued or “in-flight” for the selected disk during the sample interval.
This counter typically has a threshold of number of spindles + 2. Due to high end disk virtualization, it is difficult to determine the true number of physical spindles behind the logical disk or LUN. Therefore, this threshold will generically throw a Warning alert for an average disk queue length greater than 2.
References:

Overall Counter Instance Statistics
| Overall statistics of each of the counter instances. Min, Avg, and Max are the minimum, average, and Maximum values in the entire log. Hourly Trend is the calculated hourly slope of the entire log. 10%, 20%, and 30% of Outliers Removed is the average of the values after the percentage of outliers furthest away from the average have been removed. This is to help determine if a small percentage of the values are extreme which can skew the average. |
| Condition | LogicalDisk(*)Avg. Disk Queue Length | Min | Avg | Max | Hourly Trend | Std Deviation | 10% of Outliers Removed | 20% of Outliers Removed | 30% of Outliers Removed |
|---|---|---|---|---|---|---|---|---|---|
| OK | VIEWCS1/C: | 0 | 0 | 0 | 0 | 0 | 0 | 0 | 0 |
| OK | VIEWCS1/HarddiskVolume1 | 0 | 0 | 0 | 0 | 0 | 0 | 0 | 0 |
Alerts
| An alert is generated if any of the thresholds were broken during one of the time ranges analyzed. The background of each of the values represents the highest priority threshold that the value broke. See each of the counter’s respective analysis section for more details about what the threshold means. |
| No Alerts Found |
|---|
LogicalDisk Current Disk Queue Length
Description: Current Disk Queue Length is the number of requests outstanding on the disk at the time the performance data is collected. It also includes requests in service at the time of the collection. This is a instantaneous snapshot, not an average over the time interval. Multi-spindle disk devices can have multiple requests that are active at one time, but other concurrent requests are awaiting service. This counter might reflect a transitory high or low queue length, but if there is a sustained load on the disk drive, it is likely that this will be consistently high. Requests experience delays proportional to the length of this queue minus the number of spindles on the disks.
This analysis checks if the number of I/O request packets (IRPs) in the disk queue are at 32 or higher. Many SAN vendors use 32 as a default setting for the Host Bus Adapter (HBA) which interfaces into the fibre channel network to connect to one or more SANs. If the queue depth (simultaneous in-flight I/O) is reached frequently, then the queue depth might need to be increased.
Reference:

Overall Counter Instance Statistics
| Overall statistics of each of the counter instances. Min, Avg, and Max are the minimum, average, and Maximum values in the entire log. Hourly Trend is the calculated hourly slope of the entire log. 10%, 20%, and 30% of Outliers Removed is the average of the values after the percentage of outliers furthest away from the average have been removed. This is to help determine if a small percentage of the values are extreme which can skew the average. |
| Condition | LogicalDisk(*)Current Disk Queue Length | Min | Avg | Max | Hourly Trend | Std Deviation | 10% of Outliers Removed | 20% of Outliers Removed | 30% of Outliers Removed |
|---|---|---|---|---|---|---|---|---|---|
| OK | VIEWCS1/C: | 0 | 0 | 1 | 0 | 0 | 0 | 0 | 0 |
| OK | VIEWCS1/HarddiskVolume1 | 0 | 0 | 0 | 0 | 0 | 0 | 0 | 0 |
Alerts
| An alert is generated if any of the thresholds were broken during one of the time ranges analyzed. The background of each of the values represents the highest priority threshold that the value broke. See each of the counter’s respective analysis section for more details about what the threshold means. |
| No Alerts Found |
|---|
LogicalDisk Disk Bytes/sec
Description: Disk Bytes/sec is the rate bytes are transferred to or from the disk during write or read operations. A mirror pair (RAID1) 7200 RPM disk drives can deliver roughly 20 MB per second throughput.

Overall Counter Instance Statistics
| Overall statistics of each of the counter instances. Min, Avg, and Max are the minimum, average, and Maximum values in the entire log. Hourly Trend is the calculated hourly slope of the entire log. 10%, 20%, and 30% of Outliers Removed is the average of the values after the percentage of outliers furthest away from the average have been removed. This is to help determine if a small percentage of the values are extreme which can skew the average. |
| Condition | LogicalDisk(*)Disk Bytes/sec | Min | Avg | Max | Hourly Trend | Std Deviation | 10% of Outliers Removed | 20% of Outliers Removed | 30% of Outliers Removed |
|---|---|---|---|---|---|---|---|---|---|
| No Thresholds | VIEWCS1/C: | 11,463 | 27,750 | 124,785 | -187,706 | 25,653 | 21,061 | 20,506 | 19,212 |
| No Thresholds | VIEWCS1/HarddiskVolume1 | 0 | 0 | 0 | 0 | 0 | 0 | 0 | 0 |
Alerts
| An alert is generated if any of the thresholds were broken during one of the time ranges analyzed. The background of each of the values represents the highest priority threshold that the value broke. See each of the counter’s respective analysis section for more details about what the threshold means. |
| No Alerts Found |
|---|
LogicalDisk Free Megabytes
Description: Free Megabytes displays the unallocated space, in megabytes, on the disk drive in megabytes. One megabyte is equal to 1,048,576 bytes.


Overall Counter Instance Statistics
| Overall statistics of each of the counter instances. Min, Avg, and Max are the minimum, average, and Maximum values in the entire log. Hourly Trend is the calculated hourly slope of the entire log. 10%, 20%, and 30% of Outliers Removed is the average of the values after the percentage of outliers furthest away from the average have been removed. This is to help determine if a small percentage of the values are extreme which can skew the average. |
| Condition | LogicalDisk(*)Free Megabytes | Min | Avg | Max | Hourly Trend | Std Deviation | 10% of Outliers Removed | 20% of Outliers Removed | 30% of Outliers Removed |
|---|---|---|---|---|---|---|---|---|---|
| OK | VIEWCS1/_Total | 22,381 | 22,381 | 22,381 | 0 | 0 | 22,381 | 22,381 | 22,381 |
| OK | VIEWCS1/C: | 22,310 | 22,310 | 22,310 | 0 | 0 | 22,310 | 22,310 | 22,310 |
| Less than 500 MB of free disk space | VIEWCS1/HarddiskVolume1 | 71 | 71 | 71 | 0 | 0 | 71 | 71 | 71 |
Alerts
| An alert is generated if any of the thresholds were broken during one of the time ranges analyzed. The background of each of the values represents the highest priority threshold that the value broke. See each of the counter’s respective analysis section for more details about what the threshold means. |
| Time Range | ||||||
|---|---|---|---|---|---|---|
| 9/25/2012 11:29:51 AM – 9/25/2012 11:30:06 AM | Condition | Counter | Min | Avg | Max | Hourly Trend |
| Less than 500 MB of free disk space | VIEWCS1LogicalDisk(HarddiskVolume1)Free Megabytes | 71 | 71 | 71 | 0 | |
| 9/25/2012 11:30:06 AM – 9/25/2012 11:30:21 AM | Condition | Counter | Min | Avg | Max | Hourly Trend |
| Less than 500 MB of free disk space | VIEWCS1LogicalDisk(HarddiskVolume1)Free Megabytes | 71 | 71 | 71 | 0 | |
| 9/25/2012 11:30:21 AM – 9/25/2012 11:30:36 AM | Condition | Counter | Min | Avg | Max | Hourly Trend |
| Less than 500 MB of free disk space | VIEWCS1LogicalDisk(HarddiskVolume1)Free Megabytes | 71 | 71 | 71 | 0 | |
| 9/25/2012 11:30:36 AM – 9/25/2012 11:30:51 AM | Condition | Counter | Min | Avg | Max | Hourly Trend |
| Less than 500 MB of free disk space | VIEWCS1LogicalDisk(HarddiskVolume1)Free Megabytes | 71 | 71 | 71 | 0 | |
| 9/25/2012 11:30:51 AM – 9/25/2012 11:31:06 AM | Condition | Counter | Min | Avg | Max | Hourly Trend |
| Less than 500 MB of free disk space | VIEWCS1LogicalDisk(HarddiskVolume1)Free Megabytes | 71 | 71 | 71 | 0 | |
| 9/25/2012 11:31:06 AM – 9/25/2012 11:31:21 AM | Condition | Counter | Min | Avg | Max | Hourly Trend |
| Less than 500 MB of free disk space | VIEWCS1LogicalDisk(HarddiskVolume1)Free Megabytes | 71 | 71 | 71 | 0 | |
| 9/25/2012 11:31:21 AM – 9/25/2012 11:31:36 AM | Condition | Counter | Min | Avg | Max | Hourly Trend |
| Less than 500 MB of free disk space | VIEWCS1LogicalDisk(HarddiskVolume1)Free Megabytes | 71 | 71 | 71 | 0 | |
| 9/25/2012 11:31:36 AM – 9/25/2012 11:31:51 AM | Condition | Counter | Min | Avg | Max | Hourly Trend |
| Less than 500 MB of free disk space | VIEWCS1LogicalDisk(HarddiskVolume1)Free Megabytes | 71 | 71 | 71 | 0 | |
| 9/25/2012 11:31:51 AM – 9/25/2012 11:32:06 AM | Condition | Counter | Min | Avg | Max | Hourly Trend |
| Less than 500 MB of free disk space | VIEWCS1LogicalDisk(HarddiskVolume1)Free Megabytes | 71 | 71 | 71 | 0 | |
| 9/25/2012 11:32:06 AM – 9/25/2012 11:32:21 AM | Condition | Counter | Min | Avg | Max | Hourly Trend |
| Less than 500 MB of free disk space | VIEWCS1LogicalDisk(HarddiskVolume1)Free Megabytes | 71 | 71 | 71 | 0 | |
| 9/25/2012 11:32:21 AM – 9/25/2012 11:32:36 AM | Condition | Counter | Min | Avg | Max | Hourly Trend |
| Less than 500 MB of free disk space | VIEWCS1LogicalDisk(HarddiskVolume1)Free Megabytes | 71 | 71 | 71 | 0 | |
| 9/25/2012 11:32:36 AM – 9/25/2012 11:32:51 AM | Condition | Counter | Min | Avg | Max | Hourly Trend |
| Less than 500 MB of free disk space | VIEWCS1LogicalDisk(HarddiskVolume1)Free Megabytes | 71 | 71 | 71 | 0 | |
| 9/25/2012 11:32:51 AM – 9/25/2012 11:33:06 AM | Condition | Counter | Min | Avg | Max | Hourly Trend |
| Less than 500 MB of free disk space | VIEWCS1LogicalDisk(HarddiskVolume1)Free Megabytes | 71 | 71 | 71 | 0 | |
| 9/25/2012 11:33:06 AM – 9/25/2012 11:33:21 AM | Condition | Counter | Min | Avg | Max | Hourly Trend |
| Less than 500 MB of free disk space | VIEWCS1LogicalDisk(HarddiskVolume1)Free Megabytes | 71 | 71 | 71 | 0 | |
| 9/25/2012 11:33:21 AM – 9/25/2012 11:33:36 AM | Condition | Counter | Min | Avg | Max | Hourly Trend |
| Less than 500 MB of free disk space | VIEWCS1LogicalDisk(HarddiskVolume1)Free Megabytes | 71 | 71 | 71 | 0 | |
| 9/25/2012 11:33:36 AM – 9/25/2012 11:33:51 AM | Condition | Counter | Min | Avg | Max | Hourly Trend |
| Less than 500 MB of free disk space | VIEWCS1LogicalDisk(HarddiskVolume1)Free Megabytes | 71 | 71 | 71 | 0 | |
| 9/25/2012 11:33:51 AM – 9/25/2012 11:33:59 AM | Condition | Counter | Min | Avg | Max | Hourly Trend |
| Less than 500 MB of free disk space | VIEWCS1LogicalDisk(HarddiskVolume1)Free Megabytes | 71 | 71 | 71 | 0 |
Memory |
Memory Available MBytes
Description:
Available MBytes is the amount of physical RAM, in Megabytes, immediately available for allocation to a process or for system use. It is equal to the sum of memory assigned to the standby (cached), free and zero page lists. If this counter is low, then the computer is running low on physical RAM.This analysis will alert a Warning if this counter’s value is less than 10% of the RAM installed and will alert a critical if this counter’s value is less than 100MB’s. When Windows Server 2003 and newer has less then 100MBs of available RAM, it will go into a low memory condition and alert processes of this condition. If in a low memory condition the operating system will be more aggressive at working set trimming which pages out the physical RAM used by processes to the pagefile on the disk.
References:

Overall Counter Instance Statistics
| Overall statistics of each of the counter instances. Min, Avg, and Max are the minimum, average, and Maximum values in the entire log. Hourly Trend is the calculated hourly slope of the entire log. 10%, 20%, and 30% of Outliers Removed is the average of the values after the percentage of outliers furthest away from the average have been removed. This is to help determine if a small percentage of the values are extreme which can skew the average. |
| Condition | MemoryAvailable MBytes | Min | Avg | Max | Hourly Trend | Std Deviation | 10% of Outliers Removed | 20% of Outliers Removed | 30% of Outliers Removed |
|---|---|---|---|---|---|---|---|---|---|
| OK | VIEWCS1 | 4,349 | 4,355 | 4,360 | 253 | 3 | 4,355 | 4,354 | 4,354 |
Alerts
| An alert is generated if any of the thresholds were broken during one of the time ranges analyzed. The background of each of the values represents the highest priority threshold that the value broke. See each of the counter’s respective analysis section for more details about what the threshold means. |
| No Alerts Found |
|---|
Memory Free System Page Table Entries
Description: Free System Page Table Entries is the number of page table entries not currently in used by the system. This analysis determines if the system is running out of free system page table entries (PTEs) by checking if there is less than 20,000 free PTE’s as a Warning and critical if there is less than 8,000 free PTEs. Lack of enough PTEs can result in system wide hangs. Also note that the /3GB switch will lower the amount of free PTEs significantly.
The Performance Monitor MemoryFree System Page Table Entries counter is inaccurate on installations of Windows Server 2003 without Service Pack 1. For more information about this counter, see Microsoft Knowledge Base article 894067. The Performance tool does not accurately show the available Free System Page Table entries in Windows Server 2003 https://go.microsoft.com/fwlink/?linkid=3052&kbid=894067
Fix for Win2003 SP1 systems with /3GB and low on PTE’s: If the system is low on PTE’s, running Windows 2003, and using /3GB switch, then consider using the /USERVA switch to give back some of the memory to the kernel. Note, this only works for Free System PTE issues.
For more information on the USERVA switch, go to:
How to use the /userva switch with the /3GB switch to tune the User-mode space to a value between 2 GB and 3 GBReference:
Ruling Out Memory-Bound Problems
How to determine the appropriate page file size for 64-bit versions of Windows Server 2003 or Windows XP

Overall Counter Instance Statistics
| Overall statistics of each of the counter instances. Min, Avg, and Max are the minimum, average, and Maximum values in the entire log. Hourly Trend is the calculated hourly slope of the entire log. 10%, 20%, and 30% of Outliers Removed is the average of the values after the percentage of outliers furthest away from the average have been removed. This is to help determine if a small percentage of the values are extreme which can skew the average. |
| Condition | MemoryFree System Page Table Entries | Min | Avg | Max | Hourly Trend | Std Deviation | 10% of Outliers Removed | 20% of Outliers Removed | 30% of Outliers Removed |
|---|---|---|---|---|---|---|---|---|---|
| OK | VIEWCS1 | 33,555,263 | 33,555,464 | 33,555,777 | 0 | 257 | 33,555,425 | 33,555,374 | 33,555,343 |
Alerts
| An alert is generated if any of the thresholds were broken during one of the time ranges analyzed. The background of each of the values represents the highest priority threshold that the value broke. See each of the counter’s respective analysis section for more details about what the threshold means. |
| No Alerts Found |
|---|
Memory Pool Non-Paged Bytes
Description: Pool Nonpaged Bytes is the size, in bytes, of the nonpaged pool, an area of system memory (physical memory used by the operating system) for objects that cannot be written to disk, but must remain in physical memory as long as they are allocated.
This analysis checks to see if the system is becoming close to the maximum Pool Nonpaged memory size. It does this by estimating the pool sizes taking into consideration /3GB, physical memory size, and 32-bit/64-bit, then determining if the value is higher than 60% of the estimated pool size. If the system becomes close to the maximum size, then the system could experience system wide hangs. Checks both 32-bit and 64-bit memory pools. Warning: The /3GB switch option in the boot.ini file significantly reduces the size of this memory pool.
If the system is low on Paged Pool or non-Paged pool memory, then it is recommended to open a support case with Microsoft to address this. Alternatively, you can use a free and public tool called Poolmon.exe to see what DLL’s are using kernel memory (see the article below). Most kernel memory leaks can be tracked back to a usermode process. To identify which user mode process is responsible, reboot the system (so you start off with a clean system), start a performance monitor log intending to run for a week or more capturing the Memory and Process objects, then analyze the perfmon log looking for memory leaks and/or handle leaks in one or more of the processes. In any case, migrating to a 64-bit version of Windows should alleviate this issue.
References
How to Use Memory Pool Monitor (Poolmon.exe) to Troubleshoot Kernel Mode Memory Leaks
https://support.microsoft.com/kb/177415
Ruling Out Memory-Bound Problems
https://technet.microsoft.com/en-us/library/7a44b064-8872-4edf-aac7-36b2a17f662a.aspx
How to determine the appropriate page file size for 64-bit versions of Windows Server 2003 or Windows XP
Overall Counter Instance Statistics
| Overall statistics of each of the counter instances. Min, Avg, and Max are the minimum, average, and Maximum values in the entire log. Hourly Trend is the calculated hourly slope of the entire log. 10%, 20%, and 30% of Outliers Removed is the average of the values after the percentage of outliers furthest away from the average have been removed. This is to help determine if a small percentage of the values are extreme which can skew the average. |
| Condition | MemoryPool Nonpaged Bytes | Min | Avg | Max | Hourly Trend | Std Deviation | 10% of Outliers Removed | 20% of Outliers Removed | 30% of Outliers Removed |
|---|---|---|---|---|---|---|---|---|---|
| OK | VIEWCS1 | 39,096,320 | 39,222,613 | 39,251,968 | 4,032,000 | 46,004 | 39,219,200 | 39,215,104 | 39,212,583 |
Alerts
| An alert is generated if any of the thresholds were broken during one of the time ranges analyzed. The background of each of the values represents the highest priority threshold that the value broke. See each of the counter’s respective analysis section for more details about what the threshold means. |
| No Alerts Found |
|---|
Memory Pool Paged Bytes
Description: This analysis checks to see if the system is becoming close to the maximum Pool paged memory size. Pool Paged Bytes is the size, in bytes, of the paged pool, an area of system memory (physical memory used by the operating system) for objects that can be written to disk when they are not being used.
This analysis checks to see if the system is becoming close to the maximum Pool Paged memory size. It does this by estimating the pool sizes taking into consideration /3GB, physical memory size, and 32-bit/64-bit, then determining if the value is higher than 60% of the estimated pool size. If the system becomes close to the maximum size, then the system could experience system wide hangs. Checks both 32-bit and 64-bit memory pools. Warning: The /3GB switch option in the boot.ini file significantly reduces the size of this memory pool.
If the system is low on Paged Pool or non-Paged pool memory, then it is recommended to open a support case with Microsoft to address this. Alternatively, you can use a free and public tool called Poolmon.exe to see what DLL’s are using kernel memory (see the article below). Most kernel memory leaks can be tracked back to a usermode process. To identify which user mode process is responsible, reboot the system (so you start off with a clean system), start a performance monitor log intending to run for a week or more capturing the Memory and Process objects, then analyze the perfmon log looking for memory leaks and/or handle leaks in one or more of the processes. In any case, migrating to a 64-bit version of Windows should alleviate this issue.
Reference:
How to Use Memory Pool Monitor (Poolmon.exe) to Troubleshoot Kernel Mode Memory Leaks
https://support.microsoft.com/kb/177415
Ruling Out Memory-Bound Problems
https://technet.microsoft.com/en-us/library/7a44b064-8872-4edf-aac7-36b2a17f662a.aspx
How to determine the appropriate page file size for 64-bit versions of Windows Server 2003 or Windows XP

Overall Counter Instance Statistics
| Overall statistics of each of the counter instances. Min, Avg, and Max are the minimum, average, and Maximum values in the entire log. Hourly Trend is the calculated hourly slope of the entire log. 10%, 20%, and 30% of Outliers Removed is the average of the values after the percentage of outliers furthest away from the average have been removed. This is to help determine if a small percentage of the values are extreme which can skew the average. |
| Condition | MemoryPool Paged Bytes | Min | Avg | Max | Hourly Trend | Std Deviation | 10% of Outliers Removed | 20% of Outliers Removed | 30% of Outliers Removed |
|---|---|---|---|---|---|---|---|---|---|
| OK | VIEWCS1 | 95,801,344 | 95,851,634 | 95,891,456 | 576,000 | 21,344 | 95,848,192 | 95,846,107 | 95,845,140 |
Alerts
| An alert is generated if any of the thresholds were broken during one of the time ranges analyzed. The background of each of the values represents the highest priority threshold that the value broke. See each of the counter’s respective analysis section for more details about what the threshold means. |
| No Alerts Found |
|---|
Memory Pages/sec
Description: This analysis checks to see if the Pages/sec is high while the system is in a low memory condition. If it is sustained at a high amount, then the system is might be running out of memory by trying to page the memory to the disk. Keep in mind that all hard page faults are counted in the pages/sec counter such as hard page faults caused by memory mapped files instead of page file hits.
According to Wikipedia, memory-mapped files are a segment of virtual memory which has been assigned a direct byte-for-byte correlation with some portion of a file or file-like resource. This resource is typically a file that is physically present on-disk, but can also be a device, shared memory object, or other resource that the operating system can reference through a file descriptor.
In other words, applications like Microsoft Word and Microsoft PowerPoint will not load entire documents into RAM. Instead, they memory map the file, so that when you navigate through the document, it loads portions of the document as needed. The act of loading portions of the document from disk to RAM as a memory mapped file causes a hard page fault which is counted in the pages/sec counter. See the article The Case of the Phantom Hard Page Faults. To determine if the hard page faults are actually hitting the page file, use Process Monitor with Advanced Ouput enabled to see how often the page file(s) are hit.Pages/sec is the rate at which pages are read from or written to disk to resolve hard page faults. It is the sum of MemoryPages Input/sec and MemoryPages Output/sec. It is counted in numbers of pages, so it can be compared to other counts of pages, such as MemoryPage Faults/sec, without conversion. It includes pages retrieved to satisfy faults in the file system cache (usually requested by applications) non-cached mapped memory files.
This counter should always be below 1000, therefore this analysis checks for values above 1000. Use this analysis in correlation with Available Memory Analysis and Memory Leak Analysis. If all are throwing alerts at the same time, then this may indicate the system is running out of memory and the suspected processes involved and follow analysis steps mentioned in the Memory Leak analysis.
Reference

Overall Counter Instance Statistics
| Overall statistics of each of the counter instances. Min, Avg, and Max are the minimum, average, and Maximum values in the entire log. Hourly Trend is the calculated hourly slope of the entire log. 10%, 20%, and 30% of Outliers Removed is the average of the values after the percentage of outliers furthest away from the average have been removed. This is to help determine if a small percentage of the values are extreme which can skew the average. |
| Condition | MemoryPages/sec | Min | Avg | Max | Hourly Trend | Std Deviation | 10% of Outliers Removed | 20% of Outliers Removed | 30% of Outliers Removed |
|---|---|---|---|---|---|---|---|---|---|
| OK | VIEWCS1 | 0 | 1 | 9 | 28 | 2 | 0 | 0 | 0 |
Alerts
| An alert is generated if any of the thresholds were broken during one of the time ranges analyzed. The background of each of the values represents the highest priority threshold that the value broke. See each of the counter’s respective analysis section for more details about what the threshold means. |
| No Alerts Found |
|---|
Memory System Cache Resident Bytes
Description: System Cache Resident Bytes is the size, in bytes, of the pageable operating system code in the file system cache. This value includes only current physical pages and does not include any virtual memory pages not currently resident. It does equal the System Cache value shown in Task Manager. As a result, this value may be smaller than the actual amount of virtual memory in use by the file system cache. This value is a component of MemorySystem Code Resident Bytes which represents all pageable operating system code that is currently in physical memory. This counter displays the last observed value only; it is not an average.
This analysis checks if System Cache Resident Bytes is consuming more than 50 percent of RAM. Under load, a server might use the System Cache in order to cache I/O activity such as disk. Use in correlation with Process IO Data Operations/sec and Process IO Other Operations/sec Analyses.
References
File Cache Performance and Tuning https://technet.microsoft.com/en-us/library/bb742613.aspx

Overall Counter Instance Statistics
| Overall statistics of each of the counter instances. Min, Avg, and Max are the minimum, average, and Maximum values in the entire log. Hourly Trend is the calculated hourly slope of the entire log. 10%, 20%, and 30% of Outliers Removed is the average of the values after the percentage of outliers furthest away from the average have been removed. This is to help determine if a small percentage of the values are extreme which can skew the average. |
| Condition | MemorySystem Cache Resident Bytes | Min | Avg | Max | Hourly Trend | Std Deviation | 10% of Outliers Removed | 20% of Outliers Removed | 30% of Outliers Removed |
|---|---|---|---|---|---|---|---|---|---|
| OK | VIEWCS1 | 63,119,360 | 63,626,581 | 64,258,048 | -27,532,800 | 368,453 | 63,554,304 | 63,478,053 | 63,436,958 |
Alerts
| An alert is generated if any of the thresholds were broken during one of the time ranges analyzed. The background of each of the values represents the highest priority threshold that the value broke. See each of the counter’s respective analysis section for more details about what the threshold means. |
| No Alerts Found |
|---|
Memory Cache Bytes
Description: Cache Bytes is the sum of the MemorySystem Cache Resident Bytes, MemorySystem Driver Resident Bytes, MemorySystem Code Resident Bytes, and MemoryPool Paged Resident Bytes counters. This counter displays the last observed value only; it is not an average.

Overall Counter Instance Statistics
| Overall statistics of each of the counter instances. Min, Avg, and Max are the minimum, average, and Maximum values in the entire log. Hourly Trend is the calculated hourly slope of the entire log. 10%, 20%, and 30% of Outliers Removed is the average of the values after the percentage of outliers furthest away from the average have been removed. This is to help determine if a small percentage of the values are extreme which can skew the average. |
| Condition | MemoryCache Bytes | Min | Avg | Max | Hourly Trend | Std Deviation | 10% of Outliers Removed | 20% of Outliers Removed | 30% of Outliers Removed |
|---|---|---|---|---|---|---|---|---|---|
| OK | VIEWCS1 | 63,119,360 | 63,626,581 | 64,258,048 | -27,532,800 | 368,453 | 63,554,304 | 63,478,053 | 63,436,958 |
Alerts
| An alert is generated if any of the thresholds were broken during one of the time ranges analyzed. The background of each of the values represents the highest priority threshold that the value broke. See each of the counter’s respective analysis section for more details about what the threshold means. |
| No Alerts Found |
|---|
Memory % Committed Bytes In Use
Description: % Committed Bytes In Use is the ratio of MemoryCommitted Bytes to the MemoryCommit Limit. Committed memory is the physical memory (RAM plus all of the page files) in use for which space has been reserved in the paging file should it need to be written to disk. The commit limit is the sum of physical RAM and the size of all of the paging files. If the paging file is enlarged, the commit limit increases, and the ratio is reduced). This counter displays the current percentage value only; it is not an average.
This analysis checks if the amount of Commited memory is becoming close to the Commit Limit (RAM plus total page file sizes), If so, then identify if you have a memory leak. If no memory leak is identified, then consider adding more physical RAM or increase the size of your page files.

Overall Counter Instance Statistics
| Overall statistics of each of the counter instances. Min, Avg, and Max are the minimum, average, and Maximum values in the entire log. Hourly Trend is the calculated hourly slope of the entire log. 10%, 20%, and 30% of Outliers Removed is the average of the values after the percentage of outliers furthest away from the average have been removed. This is to help determine if a small percentage of the values are extreme which can skew the average. |
| Condition | Memory% Committed Bytes In Use | Min | Avg | Max | Hourly Trend | Std Deviation | 10% of Outliers Removed | 20% of Outliers Removed | 30% of Outliers Removed |
|---|---|---|---|---|---|---|---|---|---|
| OK | VIEWCS1 | 18 | 18 | 18 | 0 | 0 | 18 | 18 | 18 |
Alerts
| An alert is generated if any of the thresholds were broken during one of the time ranges analyzed. The background of each of the values represents the highest priority threshold that the value broke. See each of the counter’s respective analysis section for more details about what the threshold means. |
| No Alerts Found |
|---|
Memory Pages Output/sec
Description: Pages Output/sec is the rate at which pages are written to disk to free up space in physical memory. Pages are written back to disk only if they are changed in physical memory, so they are likely to hold data, not code. A high rate of pages output might indicate a memory shortage. Windows writes more pages back to disk to free up space when physical memory is in short supply. This counter shows the number of pages, and can be compared to other counts of pages, without conversion.

Overall Counter Instance Statistics
| Overall statistics of each of the counter instances. Min, Avg, and Max are the minimum, average, and Maximum values in the entire log. Hourly Trend is the calculated hourly slope of the entire log. 10%, 20%, and 30% of Outliers Removed is the average of the values after the percentage of outliers furthest away from the average have been removed. This is to help determine if a small percentage of the values are extreme which can skew the average. |
| Condition | MemoryPages Output/sec | Min | Avg | Max | Hourly Trend | Std Deviation | 10% of Outliers Removed | 20% of Outliers Removed | 30% of Outliers Removed |
|---|---|---|---|---|---|---|---|---|---|
| No Thresholds | VIEWCS1 | 0 | 0 | 0 | 0 | 0 | 0 | 0 | 0 |
Alerts
| An alert is generated if any of the thresholds were broken during one of the time ranges analyzed. The background of each of the values represents the highest priority threshold that the value broke. See each of the counter’s respective analysis section for more details about what the threshold means. |
| No Alerts Found |
|---|
Memory Transition Pages RePurposed/sec
Description: Transition Pages RePurposed is the rate at which the number of transition cache pages were reused for a different purpose. These pages would have otherwise remained in the page cache to provide a (fast) soft fault (instead of retrieving it from backing store) in the event the page was accessed in the future. Note these pages can contain private or sharable memory.

Overall Counter Instance Statistics
| Overall statistics of each of the counter instances. Min, Avg, and Max are the minimum, average, and Maximum values in the entire log. Hourly Trend is the calculated hourly slope of the entire log. 10%, 20%, and 30% of Outliers Removed is the average of the values after the percentage of outliers furthest away from the average have been removed. This is to help determine if a small percentage of the values are extreme which can skew the average. |
| Condition | MemoryTransition Pages RePurposed/sec | Min | Avg | Max | Hourly Trend | Std Deviation | 10% of Outliers Removed | 20% of Outliers Removed | 30% of Outliers Removed |
|---|---|---|---|---|---|---|---|---|---|
| No Thresholds | VIEWCS1 | 0 | 0 | 0 | 0 | 0 | 0 | 0 | 0 |
Alerts
| An alert is generated if any of the thresholds were broken during one of the time ranges analyzed. The background of each of the values represents the highest priority threshold that the value broke. See each of the counter’s respective analysis section for more details about what the threshold means. |
| No Alerts Found |
|---|
Memory Committed Bytes
Description: Committed Bytes is the amount of committed virtual memory, in bytes. Committed memory is the memory which has space reserved in RAM and on the disk paging file(s). There can be one or more paging files on each physical drive. This counter displays the last observed value only; it is not an average.
This analysis checks if the amount of total committed memory (Commit Charge) exceeds the amount of physical RAM installed. If so, the page file needs to be used to help store the committed memory and performance might degrade. To alleviate this, try to identify which process is consuming the most committed memory by looking at process Private Bytes and looking for a potential memory leak (the consumption of memory over a long period of time without releasing it). Adding more RAM to the computer will help alleviate this issue, but if it is a memory leak, then the problem might return.

Overall Counter Instance Statistics
| Overall statistics of each of the counter instances. Min, Avg, and Max are the minimum, average, and Maximum values in the entire log. Hourly Trend is the calculated hourly slope of the entire log. 10%, 20%, and 30% of Outliers Removed is the average of the values after the percentage of outliers furthest away from the average have been removed. This is to help determine if a small percentage of the values are extreme which can skew the average. |
| Condition | MemoryCommitted Bytes | Min | Avg | Max | Hourly Trend | Std Deviation | 10% of Outliers Removed | 20% of Outliers Removed | 30% of Outliers Removed |
|---|---|---|---|---|---|---|---|---|---|
| No Thresholds | VIEWCS1 | 2,323,709,952 | 2,330,340,238 | 2,339,000,320 | -195,264,000 | 4,917,526 | 2,329,307,392 | 2,328,385,243 | 2,328,101,179 |
Alerts
| An alert is generated if any of the thresholds were broken during one of the time ranges analyzed. The background of each of the values represents the highest priority threshold that the value broke. See each of the counter’s respective analysis section for more details about what the threshold means. |
| No Alerts Found |
|---|
Memory Commit Limit
Description: Commit Limit is the amount of virtual memory that can be committed without having to extend the paging file(s). It is measured in bytes. Committed memory is the physical memory which has space reserved on the disk paging files. There can be one paging file on each logical drive). If the paging file(s) are be expanded, this limit increases accordingly. This counter displays the last observed value only; it is not an average.
Overall Counter Instance Statistics
| Overall statistics of each of the counter instances. Min, Avg, and Max are the minimum, average, and Maximum values in the entire log. Hourly Trend is the calculated hourly slope of the entire log. 10%, 20%, and 30% of Outliers Removed is the average of the values after the percentage of outliers furthest away from the average have been removed. This is to help determine if a small percentage of the values are extreme which can skew the average. |
| Condition | MemoryCommit Limit | Min | Avg | Max | Hourly Trend | Std Deviation | 10% of Outliers Removed | 20% of Outliers Removed | 30% of Outliers Removed |
|---|---|---|---|---|---|---|---|---|---|
| No Thresholds | VIEWCS1 | 12,881,948,672 | 12,881,948,672 | 12,881,948,672 | 0 | 0 | 12,881,948,672 | 12,881,948,672 | 12,881,948,672 |
Alerts
| An alert is generated if any of the thresholds were broken during one of the time ranges analyzed. The background of each of the values represents the highest priority threshold that the value broke. See each of the counter’s respective analysis section for more details about what the threshold means. |
| No Alerts Found |
|---|
Memory Pages Input/sec
Description: Pages Input/sec is the rate at which pages are read from disk to resolve hard page faults. Hard page faults occur when a process refers to a page in virtual memory that is not in its working set or elsewhere in physical memory, and must be retrieved from disk. When a page is faulted, the system tries to read multiple contiguous pages into memory to maximize the benefit of the read operation. Compare the value of MemoryPages Input/sec to the value of MemoryPage Reads/sec to determine the average number of pages read into memory during each read operation.
This analysis checks for more than 1000 page inputs per second. If there is a lot of page inputs per second, then it could be normal file I/O reading from the disk as memory mapped files, or it could be reading from the page file. This counter is not an indicator of a lack of memory condition unless there is a lot of memory pressure corresponding to this alert.
Overall Counter Instance Statistics
| Overall statistics of each of the counter instances. Min, Avg, and Max are the minimum, average, and Maximum values in the entire log. Hourly Trend is the calculated hourly slope of the entire log. 10%, 20%, and 30% of Outliers Removed is the average of the values after the percentage of outliers furthest away from the average have been removed. This is to help determine if a small percentage of the values are extreme which can skew the average. |
| Condition | MemoryPages Input/sec | Min | Avg | Max | Hourly Trend | Std Deviation | 10% of Outliers Removed | 20% of Outliers Removed | 30% of Outliers Removed |
|---|---|---|---|---|---|---|---|---|---|
| OK | VIEWCS1 | 0 | 1 | 9 | 28 | 2 | 0 | 0 | 0 |
Alerts
| An alert is generated if any of the thresholds were broken during one of the time ranges analyzed. The background of each of the values represents the highest priority threshold that the value broke. See each of the counter’s respective analysis section for more details about what the threshold means. |
| No Alerts Found |
|---|
Memory Free & Zero Page List Bytes
Description: Free & Zero Page List Bytes is the amount of physical memory, in bytes, that is assigned to the free and zero page lists. This memory does not contain cached data. It is immediately available for allocation to a process or for system use. For a full explanation of the memory manager, refer to MSDN and/or the System Performance and Troubleshooting Guide chapter in the Windows Server 2003 Resource Kit.
If the size of the Free and Zero page list is large, then it is a good indicator of too much RAM installed on the computer. A large amount of Free and Zero page list size is normal for computers that have been recently powered on or booted. As the system accesses the hard disk placing pages of memory into the working sets of processes, eventually many of those pages of memory will be discarded or paged out. When that happens, the memory is often placed on the Standby list. A large Standby list is preferable because it uses the extra RAM as a disk cache. Available memory is the sum of the Free, Zero, and Standby page lists, so a high amount of available memory with a low amount of Zero and Free is preferred because the system is using the extra RAM as disk cache.
Overall Counter Instance Statistics
| Overall statistics of each of the counter instances. Min, Avg, and Max are the minimum, average, and Maximum values in the entire log. Hourly Trend is the calculated hourly slope of the entire log. 10%, 20%, and 30% of Outliers Removed is the average of the values after the percentage of outliers furthest away from the average have been removed. This is to help determine if a small percentage of the values are extreme which can skew the average. |
| Condition | MemoryFree & Zero Page List Bytes | Min | Avg | Max | Hourly Trend | Std Deviation | 10% of Outliers Removed | 20% of Outliers Removed | 30% of Outliers Removed |
|---|---|---|---|---|---|---|---|---|---|
| No Thresholds | VIEWCS1 | 3,517,157,376 | 3,522,989,170 | 3,526,610,944 | 187,430,400 | 2,804,979 | 3,522,536,704 | 3,521,994,459 | 3,521,793,733 |
Alerts
| An alert is generated if any of the thresholds were broken during one of the time ranges analyzed. The background of each of the values represents the highest priority threshold that the value broke. See each of the counter’s respective analysis section for more details about what the threshold means. |
| No Alerts Found |
|---|
Network Interface |
Network Interface % Network Utilization
Description: % Network Utilization doesn’t exist as a normal performance counter, so this analysis uses multiplies Network Interface(*)Bytes Total/sec by 8 (to convert it to bits total/sec), divides it by Network Interface(*)Current Bandwidth, and multiplies the result by 100 to create a percentage. This analysis throws a warning alert when greater than 50 and throws a critical alert when greater than 80.

Overall Counter Instance Statistics
| Overall statistics of each of the counter instances. Min, Avg, and Max are the minimum, average, and Maximum values in the entire log. Hourly Trend is the calculated hourly slope of the entire log. 10%, 20%, and 30% of Outliers Removed is the average of the values after the percentage of outliers furthest away from the average have been removed. This is to help determine if a small percentage of the values are extreme which can skew the average. |
| Condition | Network Interface(*)% Network Utilization | Min | Avg | Max | Hourly Trend | Std Deviation | 10% of Outliers Removed | 20% of Outliers Removed | 30% of Outliers Removed |
|---|---|---|---|---|---|---|---|---|---|
| OK | VIEWCS1/isatap.{F235FC61-062F-4875-A6FB-D9FEB057A7BB} | 0 | 0 | 0 | 0 | 0 | 0 | 0 | 0 |
| OK | VIEWCS1/Local Area Connection* 11 | 0 | 0 | 0 | 0 | 0 | 0 | 0 | 0 |
| OK | VIEWCS1/vmxnet3 Ethernet Adapter _2 | 0 | 0 | 0 | 0 | 0 | 0 | 0 | 0 |
Alerts
| An alert is generated if any of the thresholds were broken during one of the time ranges analyzed. The background of each of the values represents the highest priority threshold that the value broke. See each of the counter’s respective analysis section for more details about what the threshold means. |
| No Alerts Found |
|---|
Network Interface Output Queue Length
Description:

Overall Counter Instance Statistics
| Overall statistics of each of the counter instances. Min, Avg, and Max are the minimum, average, and Maximum values in the entire log. Hourly Trend is the calculated hourly slope of the entire log. 10%, 20%, and 30% of Outliers Removed is the average of the values after the percentage of outliers furthest away from the average have been removed. This is to help determine if a small percentage of the values are extreme which can skew the average. |
| Condition | Network Interface(*)Output Queue Length | Min | Avg | Max | Hourly Trend | Std Deviation | 10% of Outliers Removed | 20% of Outliers Removed | 30% of Outliers Removed |
|---|---|---|---|---|---|---|---|---|---|
| OK | VIEWCS1/isatap.{F235FC61-062F-4875-A6FB-D9FEB057A7BB} | 0 | 0 | 0 | 0 | 0 | 0 | 0 | 0 |
| OK | VIEWCS1/Local Area Connection* 11 | 0 | 0 | 0 | 0 | 0 | 0 | 0 | 0 |
| OK | VIEWCS1/vmxnet3 Ethernet Adapter _2 | 0 | 0 | 0 | 0 | 0 | 0 | 0 | 0 |
Alerts
| An alert is generated if any of the thresholds were broken during one of the time ranges analyzed. The background of each of the values represents the highest priority threshold that the value broke. See each of the counter’s respective analysis section for more details about what the threshold means. |
| No Alerts Found |
|---|
Network Interface % Network Utilization Sent
Description: % Network Utilization Sent doesn’t exist as a normal performance counter, so this analysis uses multiplies Network Interface(*)Bytes Sent/sec by 8 (to convert it to bits total/sec), divides it by Network Interface(*)Current Bandwidth, and multiplies the result by 100 to create a percentage. This analysis throws a warning alert when greater than 50 and throws a critical alert when greater than 80.

Overall Counter Instance Statistics
| Overall statistics of each of the counter instances. Min, Avg, and Max are the minimum, average, and Maximum values in the entire log. Hourly Trend is the calculated hourly slope of the entire log. 10%, 20%, and 30% of Outliers Removed is the average of the values after the percentage of outliers furthest away from the average have been removed. This is to help determine if a small percentage of the values are extreme which can skew the average. |
| Condition | Network Interface(*)% Network Utilization Sent | Min | Avg | Max | Hourly Trend | Std Deviation | 10% of Outliers Removed | 20% of Outliers Removed | 30% of Outliers Removed |
|---|---|---|---|---|---|---|---|---|---|
| OK | VIEWCS1/vmxnet3 Ethernet Adapter _2 | 0 | 0 | 0 | 0 | 0 | 0 | 0 | 0 |
| OK | VIEWCS1/Local Area Connection* 11 | 0 | 0 | 0 | 0 | 0 | 0 | 0 | 0 |
| OK | VIEWCS1/isatap.{F235FC61-062F-4875-A6FB-D9FEB057A7BB} | 0 | 0 | 0 | 0 | 0 | 0 | 0 | 0 |
Alerts
| An alert is generated if any of the thresholds were broken during one of the time ranges analyzed. The background of each of the values represents the highest priority threshold that the value broke. See each of the counter’s respective analysis section for more details about what the threshold means. |
| No Alerts Found |
|---|
Network Interface % Network Utilization Received
Description: % Network Utilization Received doesn’t exist as a normal performance counter, so this analysis uses multiplies Network Interface(*)Bytes Received/sec by 8 (to convert it to bits total/sec), divides it by Network Interface(*)Current Bandwidth, and multiplies the result by 100 to create a percentage. This analysis throws a warning alert when greater than 50 and throws a critical alert when greater than 80.
Overall Counter Instance Statistics
| Overall statistics of each of the counter instances. Min, Avg, and Max are the minimum, average, and Maximum values in the entire log. Hourly Trend is the calculated hourly slope of the entire log. 10%, 20%, and 30% of Outliers Removed is the average of the values after the percentage of outliers furthest away from the average have been removed. This is to help determine if a small percentage of the values are extreme which can skew the average. |
| Condition | Network Interface(*)% Network Utilization Received | Min | Avg | Max | Hourly Trend | Std Deviation | 10% of Outliers Removed | 20% of Outliers Removed | 30% of Outliers Removed |
|---|---|---|---|---|---|---|---|---|---|
| OK | VIEWCS1/isatap.{F235FC61-062F-4875-A6FB-D9FEB057A7BB} | 0 | 0 | 0 | 0 | 0 | 0 | 0 | 0 |
| OK | VIEWCS1/Local Area Connection* 11 | 0 | 0 | 0 | 0 | 0 | 0 | 0 | 0 |
| OK | VIEWCS1/vmxnet3 Ethernet Adapter _2 | 0 | 0 | 0 | 0 | 0 | 0 | 0 | 0 |
Alerts
| An alert is generated if any of the thresholds were broken during one of the time ranges analyzed. The background of each of the values represents the highest priority threshold that the value broke. See each of the counter’s respective analysis section for more details about what the threshold means. |
| No Alerts Found |
|---|
Network Interface Packets Outbound Errors
Description: Packets Outbound Errors is the number of outbound packets that could not be transmitted because of errors.
If errors are occuring during this analysis, network connectivity could be affected with a potential for random Outlook RPC dialog boxes. See https://technet.microsoft.com/en-us/library/aa997363.aspx and https://technet.microsoft.com/en-us/library/aa995850.asp for more information
Overall Counter Instance Statistics
| Overall statistics of each of the counter instances. Min, Avg, and Max are the minimum, average, and Maximum values in the entire log. Hourly Trend is the calculated hourly slope of the entire log. 10%, 20%, and 30% of Outliers Removed is the average of the values after the percentage of outliers furthest away from the average have been removed. This is to help determine if a small percentage of the values are extreme which can skew the average. |
| Condition | Network Interface(*)Packets Outbound Errors | Min | Avg | Max | Hourly Trend | Std Deviation | 10% of Outliers Removed | 20% of Outliers Removed | 30% of Outliers Removed |
|---|---|---|---|---|---|---|---|---|---|
| OK | VIEWCS1/isatap.{F235FC61-062F-4875-A6FB-D9FEB057A7BB} | 0 | 0 | 0 | 0 | 0 | 0 | 0 | 0 |
| OK | VIEWCS1/Local Area Connection* 11 | 0 | 0 | 0 | 0 | 0 | 0 | 0 | 0 |
| OK | VIEWCS1/vmxnet3 Ethernet Adapter _2 | 0 | 0 | 0 | 0 | 0 | 0 | 0 | 0 |
Alerts
| An alert is generated if any of the thresholds were broken during one of the time ranges analyzed. The background of each of the values represents the highest priority threshold that the value broke. See each of the counter’s respective analysis section for more details about what the threshold means. |
| No Alerts Found |
|---|
Network Interface Bytes Total/sec
Description: Bytes Total/sec is the rate at which bytes are sent and received over each network adapter, including framing characters. Network InterfaceBytes Total/sec is a sum of Network InterfaceBytes Received/sec and Network InterfaceBytes Sent/sec.

Overall Counter Instance Statistics
| Overall statistics of each of the counter instances. Min, Avg, and Max are the minimum, average, and Maximum values in the entire log. Hourly Trend is the calculated hourly slope of the entire log. 10%, 20%, and 30% of Outliers Removed is the average of the values after the percentage of outliers furthest away from the average have been removed. This is to help determine if a small percentage of the values are extreme which can skew the average. |
| Condition | Network Interface(*)Bytes Total/sec | Min | Avg | Max | Hourly Trend | Std Deviation | 10% of Outliers Removed | 20% of Outliers Removed | 30% of Outliers Removed |
|---|---|---|---|---|---|---|---|---|---|
| No Thresholds | VIEWCS1/isatap.{F235FC61-062F-4875-A6FB-D9FEB057A7BB} | 0 | 0 | 0 | 0 | 0 | 0 | 0 | 0 |
| No Thresholds | VIEWCS1/Local Area Connection* 11 | 0 | 0 | 0 | 0 | 0 | 0 | 0 | 0 |
| No Thresholds | VIEWCS1/vmxnet3 Ethernet Adapter _2 | 5,766 | 11,485 | 25,417 | 467,494 | 5,686 | 9,888 | 9,133 | 8,526 |
Alerts
| An alert is generated if any of the thresholds were broken during one of the time ranges analyzed. The background of each of the values represents the highest priority threshold that the value broke. See each of the counter’s respective analysis section for more details about what the threshold means. |
| No Alerts Found |
|---|
Network Interface Current Bandwidth
Description: Current Bandwidth is an estimate of the current bandwidth of the network interface in bits per second (BPS). For interfaces that do not vary in bandwidth or for those where no accurate estimation can be made, this value is the nominal bandwidth.

Overall Counter Instance Statistics
| Overall statistics of each of the counter instances. Min, Avg, and Max are the minimum, average, and Maximum values in the entire log. Hourly Trend is the calculated hourly slope of the entire log. 10%, 20%, and 30% of Outliers Removed is the average of the values after the percentage of outliers furthest away from the average have been removed. This is to help determine if a small percentage of the values are extreme which can skew the average. |
| Condition | Network Interface(*)Current Bandwidth | Min | Avg | Max | Hourly Trend | Std Deviation | 10% of Outliers Removed | 20% of Outliers Removed | 30% of Outliers Removed |
|---|---|---|---|---|---|---|---|---|---|
| No Thresholds | VIEWCS1/isatap.{F235FC61-062F-4875-A6FB-D9FEB057A7BB} | 100,000 | 100,000 | 100,000 | 0 | 0 | 100,000 | 100,000 | 100,000 |
| No Thresholds | VIEWCS1/Local Area Connection* 11 | 100,000 | 100,000 | 100,000 | 0 | 0 | 100,000 | 100,000 | 100,000 |
| No Thresholds | VIEWCS1/vmxnet3 Ethernet Adapter _2 | 10,000,000,000 | 10,000,000,000 | 10,000,000,000 | 0 | 0 | 10,000,000,000 | 10,000,000,000 | 10,000,000,000 |
Alerts
| An alert is generated if any of the thresholds were broken during one of the time ranges analyzed. The background of each of the values represents the highest priority threshold that the value broke. See each of the counter’s respective analysis section for more details about what the threshold means. |
| No Alerts Found |
|---|
Network Interface Packets/sec
Description: Packets/sec is the rate at which packets are sent and received on the network interface.

Overall Counter Instance Statistics
| Overall statistics of each of the counter instances. Min, Avg, and Max are the minimum, average, and Maximum values in the entire log. Hourly Trend is the calculated hourly slope of the entire log. 10%, 20%, and 30% of Outliers Removed is the average of the values after the percentage of outliers furthest away from the average have been removed. This is to help determine if a small percentage of the values are extreme which can skew the average. |
| Condition | Network Interface(*)Packets/sec | Min | Avg | Max | Hourly Trend | Std Deviation | 10% of Outliers Removed | 20% of Outliers Removed | 30% of Outliers Removed |
|---|---|---|---|---|---|---|---|---|---|
| No Thresholds | VIEWCS1/isatap.{F235FC61-062F-4875-A6FB-D9FEB057A7BB} | 0 | 0 | 0 | 0 | 0 | 0 | 0 | 0 |
| No Thresholds | VIEWCS1/Local Area Connection* 11 | 0 | 0 | 0 | 0 | 0 | 0 | 0 | 0 |
| No Thresholds | VIEWCS1/vmxnet3 Ethernet Adapter _2 | 32 | 48 | 81 | 1,069 | 17 | 44 | 41 | 39 |
Alerts
| An alert is generated if any of the thresholds were broken during one of the time ranges analyzed. The background of each of the values represents the highest priority threshold that the value broke. See each of the counter’s respective analysis section for more details about what the threshold means. |
| No Alerts Found |
|---|
Network Interface Packets Sent/sec
Description: Packets Sent/sec is the rate at which packets are sent on the network interface.

Overall Counter Instance Statistics
| Overall statistics of each of the counter instances. Min, Avg, and Max are the minimum, average, and Maximum values in the entire log. Hourly Trend is the calculated hourly slope of the entire log. 10%, 20%, and 30% of Outliers Removed is the average of the values after the percentage of outliers furthest away from the average have been removed. This is to help determine if a small percentage of the values are extreme which can skew the average. |
| Condition | Network Interface(*)Packets Sent/sec | Min | Avg | Max | Hourly Trend | Std Deviation | 10% of Outliers Removed | 20% of Outliers Removed | 30% of Outliers Removed |
|---|---|---|---|---|---|---|---|---|---|
| No Thresholds | VIEWCS1/isatap.{F235FC61-062F-4875-A6FB-D9FEB057A7BB} | 0 | 0 | 0 | 0 | 0 | 0 | 0 | 0 |
| No Thresholds | VIEWCS1/Local Area Connection* 11 | 0 | 0 | 0 | 0 | 0 | 0 | 0 | 0 |
| No Thresholds | VIEWCS1/vmxnet3 Ethernet Adapter _2 | 14 | 22 | 40 | 478 | 8 | 20 | 19 | 18 |
Alerts
| An alert is generated if any of the thresholds were broken during one of the time ranges analyzed. The background of each of the values represents the highest priority threshold that the value broke. See each of the counter’s respective analysis section for more details about what the threshold means. |
| No Alerts Found |
|---|
Network Interface Packets Received/sec
Description: Packets Received/sec is the rate at which packets are received on the network interface.

Overall Counter Instance Statistics
| Overall statistics of each of the counter instances. Min, Avg, and Max are the minimum, average, and Maximum values in the entire log. Hourly Trend is the calculated hourly slope of the entire log. 10%, 20%, and 30% of Outliers Removed is the average of the values after the percentage of outliers furthest away from the average have been removed. This is to help determine if a small percentage of the values are extreme which can skew the average. |
| Condition | Network Interface(*)Packets Received/sec | Min | Avg | Max | Hourly Trend | Std Deviation | 10% of Outliers Removed | 20% of Outliers Removed | 30% of Outliers Removed |
|---|---|---|---|---|---|---|---|---|---|
| No Thresholds | VIEWCS1/isatap.{F235FC61-062F-4875-A6FB-D9FEB057A7BB} | 0 | 0 | 0 | 0 | 0 | 0 | 0 | 0 |
| No Thresholds | VIEWCS1/Local Area Connection* 11 | 0 | 0 | 0 | 0 | 0 | 0 | 0 | 0 |
| No Thresholds | VIEWCS1/vmxnet3 Ethernet Adapter _2 | 17 | 26 | 44 | 619 | 8 | 24 | 22 | 21 |
Alerts
| An alert is generated if any of the thresholds were broken during one of the time ranges analyzed. The background of each of the values represents the highest priority threshold that the value broke. See each of the counter’s respective analysis section for more details about what the threshold means. |
| No Alerts Found |
|---|
Paging File |
Paging File % Usage
Description: The amount of the Page File instance in use in percent. See also ProcessPage File Bytes.
This analysis checks if the percentage of usage is greater than 70%.
Reference
How to determine the appropriate page file size for 64-bit versions of Windows Server 2003 or Windows XP

Overall Counter Instance Statistics
| Overall statistics of each of the counter instances. Min, Avg, and Max are the minimum, average, and Maximum values in the entire log. Hourly Trend is the calculated hourly slope of the entire log. 10%, 20%, and 30% of Outliers Removed is the average of the values after the percentage of outliers furthest away from the average have been removed. This is to help determine if a small percentage of the values are extreme which can skew the average. |
| Condition | Paging File(*)% Usage | Min | Avg | Max | Hourly Trend | Std Deviation | 10% of Outliers Removed | 20% of Outliers Removed | 30% of Outliers Removed |
|---|---|---|---|---|---|---|---|---|---|
| OK | VIEWCS1/??C:pagefile.sys | 0 | 0 | 0 | 0 | 0 | 0 | 0 | 0 |
Alerts
| An alert is generated if any of the thresholds were broken during one of the time ranges analyzed. The background of each of the values represents the highest priority threshold that the value broke. See each of the counter’s respective analysis section for more details about what the threshold means. |
| No Alerts Found |
|---|
PhysicalDisk |
PhysicalDisk Read Latency Analysis
Description: Avg. Disk sec/Read is the average time, in seconds, of a read of data to the disk. This analysis determines if any of the physical disks are responding slowly.
If the response times are greater than .015 (15 milliseconds), then the disk subsystem is keeping up with demand, but does not have much overhead left.
If the response times are greater than .025 (25 milliseconds), then noticeable slow downs and performance issues affecting users may be occurring.
Reference:
Ruling Out Disk-Bound Problems
https://technet.microsoft.com/en-us/library/5bcdd349-dcc6-43eb-9dc3-54175f7061ad.aspx

Overall Counter Instance Statistics
| Overall statistics of each of the counter instances. Min, Avg, and Max are the minimum, average, and Maximum values in the entire log. Hourly Trend is the calculated hourly slope of the entire log. 10%, 20%, and 30% of Outliers Removed is the average of the values after the percentage of outliers furthest away from the average have been removed. This is to help determine if a small percentage of the values are extreme which can skew the average. |
| Condition | PhysicalDisk(*)Avg. Disk sec/Read | Min | Avg | Max | Hourly Trend | Std Deviation | 10% of Outliers Removed | 20% of Outliers Removed | 30% of Outliers Removed |
|---|---|---|---|---|---|---|---|---|---|
| OK | VIEWCS1/0 C: | 0 | 0 | 0 | 0 | 0 | 0 | 0 | 0 |
Alerts
| An alert is generated if any of the thresholds were broken during one of the time ranges analyzed. The background of each of the values represents the highest priority threshold that the value broke. See each of the counter’s respective analysis section for more details about what the threshold means. |
| No Alerts Found |
|---|
PhysicalDisk Write Latency Analysis
Description: Avg. Disk sec/Write is the average time, in seconds, of a write of data to the disk. This analysis determines if any of the physical disks are responding slowly.
If the response times are greater than .015 (15 milliseconds), then the disk subsystem is keeping up with demand, but does not have much overhead left.
If the response times are greater than .025 (25 milliseconds), then noticeable slow downs and performance issues affecting users may be occurring.
Reference:
Ruling Out Disk-Bound Problems
https://technet.microsoft.com/en-us/library/5bcdd349-dcc6-43eb-9dc3-54175f7061ad.aspx

Overall Counter Instance Statistics
| Overall statistics of each of the counter instances. Min, Avg, and Max are the minimum, average, and Maximum values in the entire log. Hourly Trend is the calculated hourly slope of the entire log. 10%, 20%, and 30% of Outliers Removed is the average of the values after the percentage of outliers furthest away from the average have been removed. This is to help determine if a small percentage of the values are extreme which can skew the average. |
| Condition | PhysicalDisk(*)Avg. Disk sec/Write | Min | Avg | Max | Hourly Trend | Std Deviation | 10% of Outliers Removed | 20% of Outliers Removed | 30% of Outliers Removed |
|---|---|---|---|---|---|---|---|---|---|
| OK | VIEWCS1/0 C: | .001 | .001 | .001 | 0 | 0 | .001 | .001 | .001 |
Alerts
| An alert is generated if any of the thresholds were broken during one of the time ranges analyzed. The background of each of the values represents the highest priority threshold that the value broke. See each of the counter’s respective analysis section for more details about what the threshold means. |
| No Alerts Found |
|---|
PhysicalDisk Current Disk Queue Length
Description: Current Disk Queue Length is the number of requests outstanding on the disk at the time the performance data is collected. It also includes requests in service at the time of the collection. This is a instantaneous snapshot, not an average over the time interval. Multi-spindle disk devices can have multiple requests that are active at one time, but other concurrent requests are awaiting service. This counter might reflect a transitory high or low queue length, but if there is a sustained load on the disk drive, it is likely that this will be consistently high. Requests experience delays proportional to the length of this queue minus the number of spindles on the disks. For good performance, this difference should average less than two.
If the server is using an HBA (Host Bus Adapter: This is used to connect to a Storage Area Network SAN) and if the Current Disk Queue Length goes up to 32 frequently, then consider increasing the queue depth on the HBA to allow more concurrent I/O to the SAN. Please consult your SAN administrator before making any changes.
Overall Counter Instance Statistics
| Overall statistics of each of the counter instances. Min, Avg, and Max are the minimum, average, and Maximum values in the entire log. Hourly Trend is the calculated hourly slope of the entire log. 10%, 20%, and 30% of Outliers Removed is the average of the values after the percentage of outliers furthest away from the average have been removed. This is to help determine if a small percentage of the values are extreme which can skew the average. |
| Condition | PhysicalDisk(*)Current Disk Queue Length | Min | Avg | Max | Hourly Trend | Std Deviation | 10% of Outliers Removed | 20% of Outliers Removed | 30% of Outliers Removed |
|---|---|---|---|---|---|---|---|---|---|
| OK | VIEWCS1/0 C: | 0 | 0 | 1 | 0 | 0 | 0 | 0 | 0 |
Alerts
| An alert is generated if any of the thresholds were broken during one of the time ranges analyzed. The background of each of the values represents the highest priority threshold that the value broke. See each of the counter’s respective analysis section for more details about what the threshold means. |
| No Alerts Found |
|---|
PhysicalDisk Avg. Disk Queue Length
Description: Avg. Disk Queue Length is the average number of both read and write requests that were queued for the selected disk during the sample interval.
Overall Counter Instance Statistics
| Overall statistics of each of the counter instances. Min, Avg, and Max are the minimum, average, and Maximum values in the entire log. Hourly Trend is the calculated hourly slope of the entire log. 10%, 20%, and 30% of Outliers Removed is the average of the values after the percentage of outliers furthest away from the average have been removed. This is to help determine if a small percentage of the values are extreme which can skew the average. |
| Condition | PhysicalDisk(*)Avg. Disk Queue Length | Min | Avg | Max | Hourly Trend | Std Deviation | 10% of Outliers Removed | 20% of Outliers Removed | 30% of Outliers Removed |
|---|---|---|---|---|---|---|---|---|---|
| OK | VIEWCS1/0 C: | 0 | 0 | 0 | 0 | 0 | 0 | 0 | 0 |
Alerts
| An alert is generated if any of the thresholds were broken during one of the time ranges analyzed. The background of each of the values represents the highest priority threshold that the value broke. See each of the counter’s respective analysis section for more details about what the threshold means. |
| No Alerts Found |
|---|
PhysicalDisk Disk Bytes/sec
Description: Disk Bytes/sec is the rate bytes are transferred to or from the disk during write or read operations.

Overall Counter Instance Statistics
| Overall statistics of each of the counter instances. Min, Avg, and Max are the minimum, average, and Maximum values in the entire log. Hourly Trend is the calculated hourly slope of the entire log. 10%, 20%, and 30% of Outliers Removed is the average of the values after the percentage of outliers furthest away from the average have been removed. This is to help determine if a small percentage of the values are extreme which can skew the average. |
| Condition | PhysicalDisk(*)Disk Bytes/sec | Min | Avg | Max | Hourly Trend | Std Deviation | 10% of Outliers Removed | 20% of Outliers Removed | 30% of Outliers Removed |
|---|---|---|---|---|---|---|---|---|---|
| No Thresholds | VIEWCS1/0 C: | 11,463 | 27,750 | 124,785 | -187,706 | 25,653 | 21,061 | 20,506 | 19,212 |
Alerts
| An alert is generated if any of the thresholds were broken during one of the time ranges analyzed. The background of each of the values represents the highest priority threshold that the value broke. See each of the counter’s respective analysis section for more details about what the threshold means. |
| No Alerts Found |
|---|
PhysicalDisk Calculated IOPS
Description: Disk Reads/sec is the rate of read operations on the disk.


Overall Counter Instance Statistics
| Overall statistics of each of the counter instances. Min, Avg, and Max are the minimum, average, and Maximum values in the entire log. Hourly Trend is the calculated hourly slope of the entire log. 10%, 20%, and 30% of Outliers Removed is the average of the values after the percentage of outliers furthest away from the average have been removed. This is to help determine if a small percentage of the values are extreme which can skew the average. |
| Condition | PhysicalDisk(*)Disk Reads/sec | Min | Avg | Max | Hourly Trend | Std Deviation | 10% of Outliers Removed | 20% of Outliers Removed | 30% of Outliers Removed |
|---|---|---|---|---|---|---|---|---|---|
| No Thresholds | VIEWCS1/0 C: | 0 | 0 | 2 | 0 | 1 | 0 | 0 | 0 |
| Condition | PhysicalDisk(*)Disk Writes/sec | Min | Avg | Max | Hourly Trend | Std Deviation | 10% of Outliers Removed | 20% of Outliers Removed | 30% of Outliers Removed |
|---|---|---|---|---|---|---|---|---|---|
| No Thresholds | VIEWCS1/0 C: | 2 | 4 | 7 | -84 | 1 | 4 | 3 | 3 |
| Condition | PhysicalDisk(*)Calculated IOPS | Min | Avg | Max | Hourly Trend | Std Deviation | 10% of Outliers Removed | 20% of Outliers Removed | 30% of Outliers Removed |
|---|---|---|---|---|---|---|---|---|---|
| No Thresholds | VIEWCS1/0 C: | 0 | 0 | 9 | 0 | 2 | 0 | 0 | 0 |
Alerts
| An alert is generated if any of the thresholds were broken during one of the time ranges analyzed. The background of each of the values represents the highest priority threshold that the value broke. See each of the counter’s respective analysis section for more details about what the threshold means. |
| No Alerts Found |
|---|
Process |
Process Private Bytes
Description: This analysis determines if the system leaking memory over time. A process consuming large portions of memory is okay as long as the process returns the memory back to the system. Look for increasing trends in the chart. An increasing trend over a long period of time could indicate a memory leak. Private Bytes is the current size, in bytes, of memory that this process has allocated that cannot be shared with other processes. This analysis checks for a 10 MB per hour and 5 MB per hour increasing trends. Use this analysis in correlation with the Available Memory analysis.
Use this analysis in correlation with the Available Memory analysis. If you suspect a memory leak condition, then install and use the Debug Diag tool. For more information on the Debug Diag Tool, see the references section.
References:
Debug Diagnostic Tool v1.1 https://www.microsoft.com/downloads/details.aspx?FamilyID=28bd5941-c458-46f1-b24d-f60151d875a3&displaylang=en


Overall Counter Instance Statistics
| Overall statistics of each of the counter instances. Min, Avg, and Max are the minimum, average, and Maximum values in the entire log. Hourly Trend is the calculated hourly slope of the entire log. 10%, 20%, and 30% of Outliers Removed is the average of the values after the percentage of outliers furthest away from the average have been removed. This is to help determine if a small percentage of the values are extreme which can skew the average. |
| Condition | Process(*)Private Bytes | Min | Avg | Max | Hourly Trend | Std Deviation | 10% of Outliers Removed | 20% of Outliers Removed | 30% of Outliers Removed |
|---|---|---|---|---|---|---|---|---|---|
| OK | VIEWCS1/_Total | 1,772,036,096 | 1,779,402,752 | 1,787,330,560 | -9,561,600 | 4,606,345 | 1,778,440,960 | 1,777,529,710 | 1,777,154,206 |
| OK | VIEWCS1/avagent | 6,139,904 | 6,346,980 | 6,430,720 | 7,372,800 | 108,363 | 6,336,512 | 6,325,102 | 6,318,868 |
| OK | VIEWCS1/avscc | 7,184,384 | 7,184,384 | 7,184,384 | 0 | 0 | 7,184,384 | 7,184,384 | 7,184,384 |
| OK | VIEWCS1/csrss#1 | 7,987,200 | 7,987,200 | 7,987,200 | 0 | 0 | 7,987,200 | 7,987,200 | 7,987,200 |
| OK | VIEWCS1/csrss#2 | 2,076,672 | 2,076,672 | 2,076,672 | 0 | 0 | 2,076,672 | 2,076,672 | 2,076,672 |
| OK | VIEWCS1/csrss | 2,191,360 | 2,191,360 | 2,191,360 | 0 | 0 | 2,191,360 | 2,191,360 | 2,191,360 |
| OK | VIEWCS1/dllhost#1 | 1,921,024 | 1,921,024 | 1,921,024 | 0 | 0 | 1,921,024 | 1,921,024 | 1,921,024 |
| OK | VIEWCS1/dllhost | 4,349,952 | 4,349,952 | 4,349,952 | 0 | 0 | 4,349,952 | 4,349,952 | 4,349,952 |
| OK | VIEWCS1/dsamain | 36,261,888 | 36,301,938 | 36,339,712 | 1,612,800 | 28,188 | 36,297,728 | 36,294,071 | 36,291,820 |
| OK | VIEWCS1/dwm | 1,589,248 | 1,589,248 | 1,589,248 | 0 | 0 | 1,589,248 | 1,589,248 | 1,589,248 |
| OK | VIEWCS1/explorer | 14,254,080 | 14,453,419 | 14,954,496 | -17,510,400 | 234,373 | 14,391,808 | 14,356,480 | 14,334,740 |
| OK | VIEWCS1/FlashUtil32_11_4_402_278_ActiveX | 2,469,888 | 2,469,888 | 2,469,888 | 0 | 0 | 2,469,888 | 2,469,888 | 2,469,888 |
| OK | VIEWCS1/Idle | 0 | 0 | 0 | 0 | 0 | 0 | 0 | 0 |
| OK | VIEWCS1/iexplore#1 | 82,227,200 | 82,227,200 | 82,227,200 | 0 | 0 | 82,227,200 | 82,227,200 | 82,227,200 |
| OK | VIEWCS1/iexplore#2 | 15,691,776 | 15,728,185 | 15,835,136 | 1,036,800 | 52,659 | 15,714,816 | 15,702,309 | 15,700,283 |
| OK | VIEWCS1/iexplore#3 | 58,568,704 | 58,568,704 | 58,568,704 | 0 | 0 | 58,568,704 | 58,568,704 | 58,568,704 |
| OK | VIEWCS1/iexplore | 9,064,448 | 9,167,531 | 9,175,040 | 0 | 25,839 | 9,166,592 | 9,165,385 | 9,164,642 |
| OK | VIEWCS1/LogonUI | 8,704,000 | 8,704,000 | 8,704,000 | 0 | 0 | 8,704,000 | 8,704,000 | 8,704,000 |
| OK | VIEWCS1/lsass | 7,303,168 | 7,314,773 | 7,372,800 | -1,958,400 | 26,703 | 7,307,520 | 7,303,168 | 7,303,168 |
| OK | VIEWCS1/lsm | 3,104,768 | 3,187,598 | 3,219,456 | -3,225,600 | 52,858 | 3,183,616 | 3,178,496 | 3,175,345 |
| OK | VIEWCS1/Microsoft.ActiveDirectory.WebServices | 45,813,760 | 45,930,268 | 46,862,336 | 0 | 339,089 | 45,813,760 | 45,813,760 | 45,813,760 |
| OK | VIEWCS1/mmc#1 | 52,240,384 | 52,240,384 | 52,240,384 | 0 | 0 | 52,240,384 | 52,240,384 | 52,240,384 |
| OK | VIEWCS1/mmc#2 | 28,495,872 | 28,665,856 | 29,446,144 | -26,726,400 | 287,549 | 28,568,320 | 28,563,456 | 28,560,463 |
| OK | VIEWCS1/mmc | 11,980,800 | 11,980,800 | 11,980,800 | 0 | 0 | 11,980,800 | 11,980,800 | 11,980,800 |
| OK | VIEWCS1/msdtc | 3,461,120 | 3,461,120 | 3,461,120 | 0 | 0 | 3,461,120 | 3,461,120 | 3,461,120 |
| OK | VIEWCS1/rdpclip | 1,843,200 | 1,868,686 | 1,904,640 | -115,200 | 26,342 | 1,864,192 | 1,858,414 | 1,854,858 |
| OK | VIEWCS1/rundll32 | 7,716,864 | 8,052,053 | 8,155,136 | 12,326,400 | 140,725 | 8,039,168 | 8,022,601 | 8,012,406 |
| OK | VIEWCS1/SecurityGateway | 2,699,264 | 2,731,804 | 2,834,432 | 1,497,600 | 44,770 | 2,718,976 | 2,714,185 | 2,711,237 |
| OK | VIEWCS1/services | 4,673,536 | 4,717,909 | 4,726,784 | 0 | 20,420 | 4,716,800 | 4,715,374 | 4,714,496 |
| OK | VIEWCS1/smss | 466,944 | 466,944 | 466,944 | 0 | 0 | 466,944 | 466,944 | 466,944 |
| OK | VIEWCS1/spoolsv | 7,368,704 | 7,374,620 | 7,421,952 | -1,497,600 | 17,219 | 7,368,704 | 7,368,704 | 7,368,704 |
| OK | VIEWCS1/svchost#1 | 3,809,280 | 3,905,764 | 4,009,984 | -460,800 | 69,500 | 3,892,736 | 3,875,986 | 3,866,939 |
| OK | VIEWCS1/svchost#10 | 1,900,544 | 1,900,544 | 1,900,544 | 0 | 0 | 1,900,544 | 1,900,544 | 1,900,544 |
| OK | VIEWCS1/svchost#11 | 1,478,656 | 1,478,656 | 1,478,656 | 0 | 0 | 1,478,656 | 1,478,656 | 1,478,656 |
| OK | VIEWCS1/svchost#2 | 10,346,496 | 10,358,329 | 10,399,744 | -1,497,600 | 22,779 | 10,353,152 | 10,346,496 | 10,346,496 |
| OK | VIEWCS1/svchost#3 | 18,165,760 | 18,454,756 | 18,620,416 | -12,441,600 | 163,630 | 18,434,816 | 18,416,494 | 18,405,218 |
| OK | VIEWCS1/svchost#4 | 6,447,104 | 6,473,728 | 6,500,352 | 1,497,600 | 27,396 | 6,470,400 | 6,466,121 | 6,463,488 |
| OK | VIEWCS1/svchost#5 | 4,120,576 | 4,120,576 | 4,120,576 | 0 | 0 | 4,120,576 | 4,120,576 | 4,120,576 |
| OK | VIEWCS1/svchost#6 | 12,857,344 | 12,962,702 | 13,012,992 | 1,497,600 | 47,013 | 12,956,416 | 12,948,334 | 12,943,360 |
| OK | VIEWCS1/svchost#7 | 10,371,072 | 10,387,684 | 10,424,320 | 230,400 | 23,612 | 10,383,104 | 10,377,216 | 10,373,593 |
| OK | VIEWCS1/svchost#8 | 942,080 | 942,080 | 942,080 | 0 | 0 | 942,080 | 942,080 | 942,080 |
| OK | VIEWCS1/svchost#9 | 3,170,304 | 3,191,012 | 3,223,552 | -1,497,600 | 26,711 | 3,186,944 | 3,181,714 | 3,178,496 |
| OK | VIEWCS1/svchost | 4,096,000 | 4,154,709 | 4,206,592 | -2,995,200 | 39,136 | 4,148,224 | 4,140,471 | 4,135,700 |
| OK | VIEWCS1/System | 114,688 | 114,688 | 114,688 | 0 | 0 | 114,688 | 114,688 | 114,688 |
| OK | VIEWCS1/taskeng | 1,839,104 | 1,920,796 | 1,953,792 | -1,497,600 | 38,153 | 1,916,672 | 1,911,369 | 1,908,106 |
| OK | VIEWCS1/taskhost | 2,740,224 | 2,740,224 | 2,740,224 | 0 | 0 | 2,740,224 | 2,740,224 | 2,740,224 |
| OK | VIEWCS1/ViewTopoSvc | 144,412,672 | 147,640,320 | 150,740,992 | -57,024,000 | 2,381,376 | 147,252,736 | 146,754,414 | 146,447,754 |
| OK | VIEWCS1/vmtoolsd#1 | 5,312,512 | 5,312,512 | 5,312,512 | 0 | 0 | 5,312,512 | 5,312,512 | 5,312,512 |
| OK | VIEWCS1/vmtoolsd | 7,229,440 | 7,276,316 | 7,286,784 | 0 | 21,037 | 7,275,008 | 7,273,326 | 7,272,290 |
| OK | VIEWCS1/VMwareTray | 3,072,000 | 3,126,613 | 3,153,920 | -2,304,000 | 39,737 | 3,123,200 | 3,118,811 | 3,116,111 |
| OK | VIEWCS1/vmware-usbarbitrator | 2,330,624 | 2,330,624 | 2,330,624 | 0 | 0 | 2,330,624 | 2,330,624 | 2,330,624 |
| OK | VIEWCS1/wininit | 1,495,040 | 1,495,040 | 1,495,040 | 0 | 0 | 1,495,040 | 1,495,040 | 1,495,040 |
| OK | VIEWCS1/winlogon#1 | 1,691,648 | 1,691,648 | 1,691,648 | 0 | 0 | 1,691,648 | 1,691,648 | 1,691,648 |
| OK | VIEWCS1/winlogon | 1,449,984 | 1,449,984 | 1,449,984 | 0 | 0 | 1,449,984 | 1,449,984 | 1,449,984 |
| OK | VIEWCS1/WmiApSrv | 2,347,008 | 2,395,477 | 2,424,832 | 576,000 | 24,100 | 2,391,808 | 2,387,090 | 2,384,502 |
| OK | VIEWCS1/WmiPrvSE#1 | 2,854,912 | 2,954,752 | 3,076,096 | -6,220,800 | 110,385 | 2,937,417 | 2,914,304 | 2,914,304 |
| OK | VIEWCS1/WmiPrvSE | 2,494,464 | 2,604,146 | 2,736,128 | -806,400 | 64,741 | 2,587,648 | 2,579,602 | 2,575,124 |
| OK | VIEWCS1/ws_ConnectionServer | 2,527,232 | 2,527,232 | 2,527,232 | 0 | 0 | 2,527,232 | 2,527,232 | 2,527,232 |
| OK | VIEWCS1/ws_MessageBusService | 373,342,208 | 375,081,870 | 375,918,592 | 60,940,800 | 1,075,388 | 374,977,280 | 374,857,143 | 374,791,562 |
| OK | VIEWCS1/ws_TomcatService | 428,060,672 | 435,444,622 | 442,257,408 | 175,104,000 | 3,455,052 | 434,882,048 | 434,569,216 | 434,392,143 |
| OK | VIEWCS1/ws_TunnelService | 253,501,440 | 255,076,580 | 255,688,704 | -56,448,000 | 884,069 | 255,003,904 | 254,914,853 | 254,861,627 |
| OK | VIEWCS1/wsnm | 14,024,704 | 14,084,096 | 14,106,624 | 1,267,200 | 25,915 | 14,081,280 | 14,077,659 | 14,075,431 |
Alerts
| An alert is generated if any of the thresholds were broken during one of the time ranges analyzed. The background of each of the values represents the highest priority threshold that the value broke. See each of the counter’s respective analysis section for more details about what the threshold means. |
| No Alerts Found |
|---|
Process Handle Count
Description: This analysis checks overall system to determine how many handles the system has open to determine if there is a handle leak. Handle leaks can be attributed to memory leak. If this analysis throws alerts, then you need to manually open the performance monitor log and look at the instances Process(*)Handle Count to determine which process is leaking handles. Note: The normal System Overview analysis checks all of the processes.


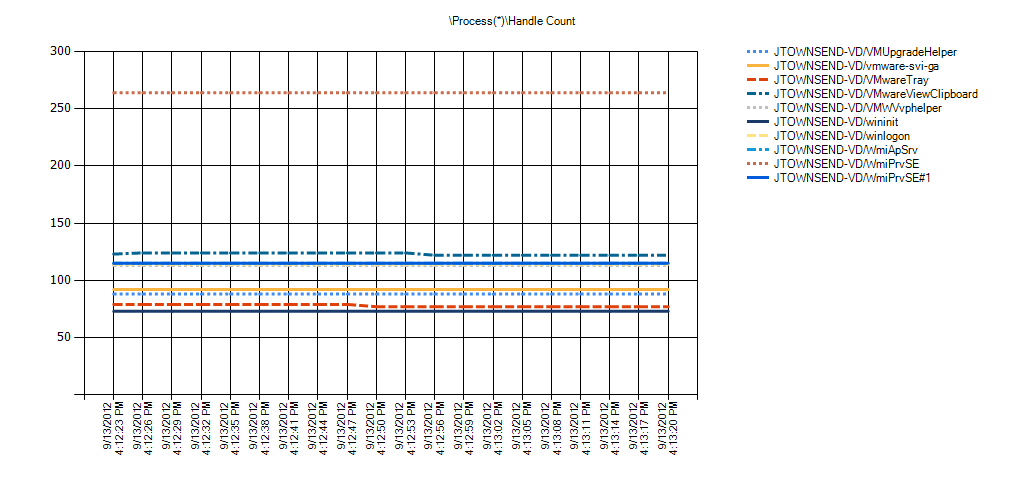
Overall Counter Instance Statistics
| Overall statistics of each of the counter instances. Min, Avg, and Max are the minimum, average, and Maximum values in the entire log. Hourly Trend is the calculated hourly slope of the entire log. 10%, 20%, and 30% of Outliers Removed is the average of the values after the percentage of outliers furthest away from the average have been removed. This is to help determine if a small percentage of the values are extreme which can skew the average. |
| Condition | Process(*)Handle Count | Min | Avg | Max | Hourly Trend | Std Deviation | 10% of Outliers Removed | 20% of Outliers Removed | 30% of Outliers Removed |
|---|---|---|---|---|---|---|---|---|---|
| OK | VIEWCS1/_Total | 21,557 | 21,737 | 22,058 | -9,816 | 170 | 21,704 | 21,676 | 21,659 |
| OK | VIEWCS1/avagent | 173 | 179 | 187 | -253 | 4 | 178 | 178 | 177 |
| OK | VIEWCS1/avscc | 138 | 138 | 138 | 0 | 0 | 138 | 138 | 138 |
| OK | VIEWCS1/csrss#1 | 72 | 72 | 72 | 0 | 0 | 72 | 72 | 72 |
| OK | VIEWCS1/csrss#2 | 299 | 304 | 315 | -422 | 5 | 303 | 302 | 302 |
| OK | VIEWCS1/csrss | 1,145 | 1,164 | 1,187 | -534 | 14 | 1,161 | 1,158 | 1,157 |
| OK | VIEWCS1/dllhost#1 | 105 | 105 | 105 | 0 | 0 | 105 | 105 | 105 |
| OK | VIEWCS1/dllhost | 197 | 197 | 197 | 0 | 0 | 197 | 197 | 197 |
| OK | VIEWCS1/dsamain | 531 | 533 | 540 | -28 | 3 | 532 | 532 | 532 |
| OK | VIEWCS1/dwm | 74 | 74 | 74 | 0 | 0 | 74 | 74 | 74 |
| OK | VIEWCS1/explorer | 549 | 560 | 614 | -1,744 | 15 | 556 | 554 | 553 |
| OK | VIEWCS1/FlashUtil32_11_4_402_278_ActiveX | 130 | 130 | 130 | 0 | 0 | 130 | 130 | 130 |
| OK | VIEWCS1/Idle | 0 | 0 | 0 | 0 | 0 | 0 | 0 | 0 |
| OK | VIEWCS1/iexplore#1 | 505 | 505 | 505 | 0 | 0 | 505 | 505 | 505 |
| OK | VIEWCS1/iexplore#2 | 558 | 560 | 564 | 28 | 2 | 560 | 560 | 560 |
| OK | VIEWCS1/iexplore#3 | 521 | 521 | 521 | 0 | 0 | 521 | 521 | 521 |
| OK | VIEWCS1/iexplore | 569 | 573 | 573 | 0 | 1 | 572 | 572 | 572 |
| OK | VIEWCS1/LogonUI | 164 | 164 | 164 | 0 | 0 | 164 | 164 | 164 |
| OK | VIEWCS1/lsass | 991 | 1,009 | 1,032 | -844 | 13 | 1,006 | 1,004 | 1,002 |
| OK | VIEWCS1/lsm | 238 | 241 | 245 | -197 | 2 | 240 | 240 | 240 |
| OK | VIEWCS1/Microsoft.ActiveDirectory.WebServices | 267 | 268 | 272 | 0 | 2 | 267 | 267 | 267 |
| OK | VIEWCS1/mmc#1 | 329 | 329 | 329 | 0 | 0 | 329 | 329 | 329 |
| OK | VIEWCS1/mmc#2 | 622 | 629 | 652 | -816 | 9 | 626 | 626 | 625 |
| OK | VIEWCS1/mmc | 195 | 195 | 195 | 0 | 0 | 195 | 195 | 195 |
| OK | VIEWCS1/msdtc | 147 | 147 | 147 | 0 | 0 | 147 | 147 | 147 |
| OK | VIEWCS1/rdpclip | 153 | 156 | 161 | -197 | 3 | 155 | 155 | 154 |
| OK | VIEWCS1/rundll32 | 257 | 260 | 261 | -28 | 1 | 259 | 259 | 259 |
| OK | VIEWCS1/SecurityGateway | 86 | 86 | 86 | 0 | 0 | 86 | 86 | 86 |
| OK | VIEWCS1/services | 266 | 268 | 268 | 0 | 1 | 268 | 268 | 268 |
| OK | VIEWCS1/smss | 33 | 33 | 33 | 0 | 0 | 33 | 33 | 33 |
| OK | VIEWCS1/spoolsv | 295 | 295 | 295 | 0 | 0 | 295 | 295 | 295 |
| OK | VIEWCS1/svchost#1 | 284 | 291 | 303 | -338 | 6 | 290 | 288 | 288 |
| OK | VIEWCS1/svchost#10 | 104 | 104 | 104 | 0 | 0 | 104 | 104 | 104 |
| OK | VIEWCS1/svchost#11 | 69 | 69 | 69 | 0 | 0 | 69 | 69 | 69 |
| OK | VIEWCS1/svchost#2 | 316 | 322 | 330 | -281 | 5 | 321 | 319 | 319 |
| OK | VIEWCS1/svchost#3 | 988 | 996 | 1,011 | -647 | 8 | 994 | 993 | 993 |
| OK | VIEWCS1/svchost#4 | 531 | 532 | 533 | 56 | 1 | 532 | 532 | 532 |
| OK | VIEWCS1/svchost#5 | 229 | 229 | 229 | 0 | 0 | 229 | 229 | 229 |
| OK | VIEWCS1/svchost#6 | 467 | 473 | 478 | 225 | 4 | 473 | 472 | 472 |
| OK | VIEWCS1/svchost#7 | 317 | 319 | 322 | -28 | 2 | 319 | 319 | 319 |
| OK | VIEWCS1/svchost#8 | 47 | 47 | 47 | 0 | 0 | 47 | 47 | 47 |
| OK | VIEWCS1/svchost#9 | 282 | 284 | 287 | -141 | 2 | 284 | 284 | 283 |
| OK | VIEWCS1/svchost | 359 | 362 | 365 | -169 | 2 | 362 | 361 | 361 |
| OK | VIEWCS1/System | 548 | 549 | 552 | -112 | 1 | 549 | 549 | 549 |
| OK | VIEWCS1/taskeng | 87 | 91 | 93 | -56 | 2 | 90 | 90 | 90 |
| OK | VIEWCS1/taskhost | 127 | 127 | 127 | 0 | 0 | 127 | 127 | 127 |
| OK | VIEWCS1/ViewTopoSvc | 937 | 968 | 984 | 759 | 16 | 966 | 964 | 963 |
| OK | VIEWCS1/vmtoolsd#1 | 164 | 164 | 164 | 0 | 0 | 164 | 164 | 164 |
| OK | VIEWCS1/vmtoolsd | 250 | 252 | 252 | 0 | 1 | 252 | 252 | 252 |
| OK | VIEWCS1/VMwareTray | 71 | 72 | 73 | -56 | 1 | 72 | 72 | 72 |
| OK | VIEWCS1/vmware-usbarbitrator | 101 | 101 | 101 | 0 | 0 | 101 | 101 | 101 |
| OK | VIEWCS1/wininit | 79 | 79 | 79 | 0 | 0 | 79 | 79 | 79 |
| OK | VIEWCS1/winlogon#1 | 100 | 100 | 100 | 0 | 0 | 100 | 100 | 100 |
| OK | VIEWCS1/winlogon | 77 | 77 | 77 | 0 | 0 | 77 | 77 | 77 |
| OK | VIEWCS1/WmiApSrv | 117 | 120 | 124 | -141 | 3 | 120 | 119 | 118 |
| OK | VIEWCS1/WmiPrvSE#1 | 139 | 142 | 147 | -169 | 4 | 142 | 141 | 141 |
| OK | VIEWCS1/WmiPrvSE | 113 | 117 | 120 | -141 | 3 | 116 | 116 | 115 |
| OK | VIEWCS1/ws_ConnectionServer | 141 | 141 | 141 | 0 | 0 | 141 | 141 | 141 |
| OK | VIEWCS1/ws_MessageBusService | 616 | 621 | 625 | -169 | 3 | 621 | 620 | 620 |
| OK | VIEWCS1/ws_TomcatService | 1,552 | 1,561 | 1,572 | 281 | 6 | 1,559 | 1,558 | 1,558 |
| OK | VIEWCS1/ws_TunnelService | 2,390 | 2,391 | 2,393 | -28 | 1 | 2,391 | 2,391 | 2,391 |
| OK | VIEWCS1/wsnm | 517 | 521 | 528 | 281 | 4 | 520 | 520 | 519 |
Alerts
| An alert is generated if any of the thresholds were broken during one of the time ranges analyzed. The background of each of the values represents the highest priority threshold that the value broke. See each of the counter’s respective analysis section for more details about what the threshold means. |
| Time Range | ||||||
|---|---|---|---|---|---|---|
| 9/25/2012 11:30:36 AM – 9/25/2012 11:30:51 AM | Condition | Counter | Min | Avg | Max | Hourly Trend |
| Possible Handle Leak: More than 500 handles between overall Min and overall Max and an increasing trend of more than 500 handles per hour | VIEWCS1Process(_Total)Handle Count | 22,058 | 22,058 | 22,058 | 16,200 |
Process Thread Count
Description: The number of threads currently active in this process. An instruction is the basic unit of execution in a processor, and a thread is the object that executes instructions. Every running process has at least one thread.
This analysis checks all of the processes to determine if a process has more than 500 threads and if it is on an increasing trend of 50 threads per hour. A process with a large number of threads and/or an aggressive upward trend could indicate a thread leak which typically results in either a memory leak or high context switching. High context switching will result in high privileged mode CPU.


Overall Counter Instance Statistics
| Overall statistics of each of the counter instances. Min, Avg, and Max are the minimum, average, and Maximum values in the entire log. Hourly Trend is the calculated hourly slope of the entire log. 10%, 20%, and 30% of Outliers Removed is the average of the values after the percentage of outliers furthest away from the average have been removed. This is to help determine if a small percentage of the values are extreme which can skew the average. |
| Condition | Process(*)Thread Count | Min | Avg | Max | Hourly Trend | Std Deviation | 10% of Outliers Removed | 20% of Outliers Removed | 30% of Outliers Removed |
|---|---|---|---|---|---|---|---|---|---|
| OK | VIEWCS1/_Total | 1,138 | 1,160 | 1,188 | -1,012 | 18 | 1,157 | 1,154 | 1,151 |
| OK | VIEWCS1/avagent | 13 | 15 | 16 | 0 | 1 | 15 | 15 | 15 |
| OK | VIEWCS1/avscc | 7 | 7 | 7 | 0 | 0 | 7 | 7 | 7 |
| OK | VIEWCS1/csrss#1 | 9 | 9 | 9 | 0 | 0 | 9 | 9 | 9 |
| OK | VIEWCS1/csrss#2 | 9 | 9 | 9 | 0 | 0 | 9 | 9 | 9 |
| OK | VIEWCS1/csrss | 9 | 9 | 9 | 0 | 0 | 9 | 9 | 9 |
| OK | VIEWCS1/dllhost#1 | 6 | 6 | 6 | 0 | 0 | 6 | 6 | 6 |
| OK | VIEWCS1/dllhost | 13 | 13 | 13 | 0 | 0 | 13 | 13 | 13 |
| OK | VIEWCS1/dsamain | 26 | 27 | 27 | 28 | 1 | 27 | 26 | 26 |
| OK | VIEWCS1/dwm | 3 | 3 | 3 | 0 | 0 | 3 | 3 | 3 |
| OK | VIEWCS1/explorer | 18 | 20 | 23 | -112 | 2 | 19 | 19 | 19 |
| OK | VIEWCS1/FlashUtil32_11_4_402_278_ActiveX | 3 | 3 | 3 | 0 | 0 | 3 | 3 | 3 |
| OK | VIEWCS1/Idle | 2 | 2 | 2 | 0 | 0 | 2 | 2 | 2 |
| OK | VIEWCS1/iexplore#1 | 15 | 15 | 15 | 0 | 0 | 15 | 15 | 15 |
| OK | VIEWCS1/iexplore#2 | 17 | 17 | 18 | 0 | 0 | 17 | 17 | 17 |
| OK | VIEWCS1/iexplore#3 | 15 | 15 | 15 | 0 | 0 | 15 | 15 | 15 |
| OK | VIEWCS1/iexplore | 13 | 14 | 14 | 0 | 0 | 14 | 14 | 14 |
| OK | VIEWCS1/LogonUI | 6 | 6 | 6 | 0 | 0 | 6 | 6 | 6 |
| OK | VIEWCS1/lsass | 9 | 9 | 10 | -28 | 0 | 9 | 9 | 9 |
| OK | VIEWCS1/lsm | 9 | 10 | 10 | -28 | 0 | 10 | 10 | 10 |
| OK | VIEWCS1/Microsoft.ActiveDirectory.WebServices | 12 | 12 | 13 | 0 | 0 | 12 | 12 | 12 |
| OK | VIEWCS1/mmc#1 | 15 | 15 | 15 | 0 | 0 | 15 | 15 | 15 |
| OK | VIEWCS1/mmc#2 | 20 | 22 | 28 | -225 | 2 | 21 | 21 | 21 |
| OK | VIEWCS1/mmc | 4 | 4 | 4 | 0 | 0 | 4 | 4 | 4 |
| OK | VIEWCS1/msdtc | 12 | 12 | 12 | 0 | 0 | 12 | 12 | 12 |
| OK | VIEWCS1/rdpclip | 7 | 8 | 9 | 0 | 1 | 8 | 8 | 7 |
| OK | VIEWCS1/rundll32 | 9 | 10 | 11 | 56 | 1 | 10 | 10 | 10 |
| OK | VIEWCS1/SecurityGateway | 7 | 7 | 7 | 0 | 0 | 7 | 7 | 7 |
| OK | VIEWCS1/services | 6 | 7 | 7 | 0 | 0 | 7 | 7 | 7 |
| OK | VIEWCS1/smss | 3 | 3 | 3 | 0 | 0 | 3 | 3 | 3 |
| OK | VIEWCS1/spoolsv | 12 | 12 | 13 | -28 | 0 | 12 | 12 | 12 |
| OK | VIEWCS1/svchost#1 | 7 | 8 | 10 | -56 | 1 | 8 | 8 | 8 |
| OK | VIEWCS1/svchost#10 | 5 | 5 | 5 | 0 | 0 | 5 | 5 | 5 |
| OK | VIEWCS1/svchost#11 | 5 | 5 | 5 | 0 | 0 | 5 | 5 | 5 |
| OK | VIEWCS1/svchost#2 | 13 | 13 | 14 | -28 | 0 | 13 | 13 | 13 |
| OK | VIEWCS1/svchost#3 | 28 | 28 | 30 | -56 | 1 | 28 | 28 | 28 |
| OK | VIEWCS1/svchost#4 | 10 | 10 | 11 | 28 | 1 | 10 | 10 | 10 |
| OK | VIEWCS1/svchost#5 | 7 | 7 | 7 | 0 | 0 | 7 | 7 | 7 |
| OK | VIEWCS1/svchost#6 | 17 | 19 | 20 | 28 | 1 | 19 | 19 | 19 |
| OK | VIEWCS1/svchost#7 | 17 | 17 | 18 | 0 | 0 | 17 | 17 | 17 |
| OK | VIEWCS1/svchost#8 | 3 | 3 | 3 | 0 | 0 | 3 | 3 | 3 |
| OK | VIEWCS1/svchost#9 | 10 | 10 | 11 | -28 | 1 | 10 | 10 | 10 |
| OK | VIEWCS1/svchost | 10 | 11 | 12 | -56 | 1 | 11 | 11 | 11 |
| OK | VIEWCS1/System | 95 | 96 | 98 | -84 | 1 | 96 | 95 | 95 |
| OK | VIEWCS1/taskeng | 5 | 6 | 7 | -28 | 1 | 6 | 6 | 6 |
| OK | VIEWCS1/taskhost | 6 | 6 | 6 | 0 | 0 | 6 | 6 | 6 |
| OK | VIEWCS1/ViewTopoSvc | 53 | 57 | 59 | -28 | 2 | 56 | 56 | 56 |
| OK | VIEWCS1/vmtoolsd#1 | 2 | 2 | 2 | 0 | 0 | 2 | 2 | 2 |
| OK | VIEWCS1/vmtoolsd | 6 | 8 | 8 | 0 | 1 | 8 | 8 | 8 |
| OK | VIEWCS1/VMwareTray | 2 | 4 | 5 | -84 | 1 | 4 | 4 | 4 |
| OK | VIEWCS1/vmware-usbarbitrator | 3 | 3 | 3 | 0 | 0 | 3 | 3 | 3 |
| OK | VIEWCS1/wininit | 3 | 3 | 3 | 0 | 0 | 3 | 3 | 3 |
| OK | VIEWCS1/winlogon#1 | 3 | 3 | 3 | 0 | 0 | 3 | 3 | 3 |
| OK | VIEWCS1/winlogon | 3 | 3 | 3 | 0 | 0 | 3 | 3 | 3 |
| OK | VIEWCS1/WmiApSrv | 5 | 6 | 7 | -56 | 1 | 6 | 6 | 6 |
| OK | VIEWCS1/WmiPrvSE#1 | 7 | 7 | 8 | -28 | 1 | 7 | 7 | 7 |
| OK | VIEWCS1/WmiPrvSE | 6 | 7 | 8 | -56 | 1 | 7 | 7 | 7 |
| OK | VIEWCS1/ws_ConnectionServer | 13 | 13 | 13 | 0 | 0 | 13 | 13 | 13 |
| OK | VIEWCS1/ws_MessageBusService | 53 | 56 | 59 | -112 | 2 | 56 | 56 | 55 |
| OK | VIEWCS1/ws_TomcatService | 129 | 134 | 140 | 141 | 3 | 133 | 132 | 132 |
| OK | VIEWCS1/ws_TunnelService | 254 | 255 | 257 | -28 | 1 | 255 | 255 | 255 |
| OK | VIEWCS1/wsnm | 40 | 42 | 43 | 56 | 1 | 42 | 42 | 42 |
Alerts
| An alert is generated if any of the thresholds were broken during one of the time ranges analyzed. The background of each of the values represents the highest priority threshold that the value broke. See each of the counter’s respective analysis section for more details about what the threshold means. |
| No Alerts Found |
|---|
Process Working Set
Description: Working Set is the current size, in bytes, of the Working Set of a process. The Working Set is the set of memory pages touched recently by the threads in the process. It is the amount of RAM consumed by each process. If available physical memory (RAM) in the computer is above a threshold, pages are left in the Working Set of a process longer. When available memory falls below a threshold, pages are trimmed from Working Sets more frequently than when not in a low available memory condition. If the trimmed page are still in RAM, but not in the processes working set (due to being trimmed), then some of them may be soft-faulted (RAM to RAM) back into the Working Set.
This analysis checks for an increasing trend of 100 MB or more per hour in all of the processes combined. This could be an aggressive working set (RAM usage) leak, but keep in mind that this is only tracking the amount of RAM used by all of the processes and does not include committed memory that has trimmed from the working set. This is generally why Private Bytes is a better counter to use for general memory leaks. With that said, Working Set is a helpful counter to have when analyzing low physical memory conditions that might be induced by page locking which can preven the virtual memory manager from trimming. Use this analysis in correlation with Available Memory Analysis.
Reference:


Overall Counter Instance Statistics
| Overall statistics of each of the counter instances. Min, Avg, and Max are the minimum, average, and Maximum values in the entire log. Hourly Trend is the calculated hourly slope of the entire log. 10%, 20%, and 30% of Outliers Removed is the average of the values after the percentage of outliers furthest away from the average have been removed. This is to help determine if a small percentage of the values are extreme which can skew the average. |
| Condition | Process(*)Working Set | Min | Avg | Max | Hourly Trend | Std Deviation | 10% of Outliers Removed | 20% of Outliers Removed | 30% of Outliers Removed |
|---|---|---|---|---|---|---|---|---|---|
| OK | VIEWCS1/_Total | 1,658,892,288 | 1,663,753,557 | 1,671,376,896 | -228,441,600 | 4,100,334 | 1,662,985,216 | 1,662,258,030 | 1,661,839,518 |
| OK | VIEWCS1/avagent | 13,336,576 | 13,449,899 | 13,500,416 | 4,032,000 | 58,096 | 13,443,584 | 13,436,928 | 13,433,305 |
| OK | VIEWCS1/avscc | 13,099,008 | 13,099,008 | 13,099,008 | 0 | 0 | 13,099,008 | 13,099,008 | 13,099,008 |
| OK | VIEWCS1/csrss#1 | 6,955,008 | 6,955,008 | 6,955,008 | 0 | 0 | 6,955,008 | 6,955,008 | 6,955,008 |
| OK | VIEWCS1/csrss#2 | 6,094,848 | 6,112,597 | 6,254,592 | -4,492,800 | 51,658 | 6,094,848 | 6,094,848 | 6,094,848 |
| OK | VIEWCS1/csrss | 4,321,280 | 4,323,556 | 4,333,568 | -115,200 | 3,211 | 4,322,816 | 4,322,450 | 4,322,225 |
| OK | VIEWCS1/dllhost#1 | 5,509,120 | 5,509,120 | 5,509,120 | 0 | 0 | 5,509,120 | 5,509,120 | 5,509,120 |
| OK | VIEWCS1/dllhost | 11,456,512 | 11,456,512 | 11,456,512 | 0 | 0 | 11,456,512 | 11,456,512 | 11,456,512 |
| OK | VIEWCS1/dsamain | 37,036,032 | 37,079,723 | 37,130,240 | 1,612,800 | 21,445 | 37,074,944 | 37,072,603 | 37,071,321 |
| OK | VIEWCS1/dwm | 4,820,992 | 4,820,992 | 4,820,992 | 0 | 0 | 4,820,992 | 4,820,992 | 4,820,992 |
| OK | VIEWCS1/explorer | 32,182,272 | 32,349,525 | 33,005,568 | -22,694,400 | 213,835 | 32,287,744 | 32,264,777 | 32,250,644 |
| OK | VIEWCS1/FlashUtil32_11_4_402_278_ActiveX | 7,143,424 | 7,143,424 | 7,143,424 | 0 | 0 | 7,143,424 | 7,143,424 | 7,143,424 |
| OK | VIEWCS1/Idle | 24,576 | 24,576 | 24,576 | 0 | 0 | 24,576 | 24,576 | 24,576 |
| OK | VIEWCS1/iexplore#1 | 96,505,856 | 96,505,856 | 96,505,856 | 0 | 0 | 96,505,856 | 96,505,856 | 96,505,856 |
| OK | VIEWCS1/iexplore#2 | 30,670,848 | 30,690,873 | 30,736,384 | 1,036,800 | 24,451 | 30,685,184 | 30,681,381 | 30,679,355 |
| OK | VIEWCS1/iexplore#3 | 72,499,200 | 72,499,200 | 72,499,200 | 0 | 0 | 72,499,200 | 72,499,200 | 72,499,200 |
| OK | VIEWCS1/iexplore | 24,428,544 | 24,541,184 | 24,592,384 | 1,843,200 | 38,069 | 24,534,784 | 24,531,237 | 24,529,054 |
| OK | VIEWCS1/LogonUI | 15,753,216 | 15,753,216 | 15,753,216 | 0 | 0 | 15,753,216 | 15,753,216 | 15,753,216 |
| OK | VIEWCS1/lsass | 15,802,368 | 15,805,099 | 15,818,752 | -460,800 | 6,283 | 15,803,392 | 15,802,368 | 15,802,368 |
| OK | VIEWCS1/lsm | 6,275,072 | 6,298,738 | 6,307,840 | -921,600 | 15,102 | 6,297,600 | 6,296,137 | 6,295,237 |
| OK | VIEWCS1/Microsoft.ActiveDirectory.WebServices | 43,171,840 | 43,173,888 | 43,192,320 | 0 | 6,002 | 43,171,840 | 43,171,840 | 43,171,840 |
| OK | VIEWCS1/mmc#1 | 24,018,944 | 24,096,313 | 24,182,784 | 4,262,400 | 51,522 | 24,086,272 | 24,077,751 | 24,072,507 |
| OK | VIEWCS1/mmc#2 | 44,347,392 | 44,472,320 | 44,765,184 | -8,985,600 | 108,536 | 44,435,968 | 44,433,408 | 44,432,148 |
| OK | VIEWCS1/mmc | 4,161,536 | 4,161,536 | 4,161,536 | 0 | 0 | 4,161,536 | 4,161,536 | 4,161,536 |
| OK | VIEWCS1/msdtc | 8,036,352 | 8,036,352 | 8,036,352 | 0 | 0 | 8,036,352 | 8,036,352 | 8,036,352 |
| OK | VIEWCS1/rdpclip | 5,668,864 | 5,702,315 | 5,718,016 | 806,400 | 11,521 | 5,700,352 | 5,698,706 | 5,698,166 |
| OK | VIEWCS1/rundll32 | 13,357,056 | 13,733,433 | 13,811,712 | 12,787,200 | 123,160 | 13,723,648 | 13,711,067 | 13,703,326 |
| OK | VIEWCS1/SecurityGateway | 7,053,312 | 7,060,139 | 7,094,272 | -115,200 | 12,566 | 7,055,872 | 7,055,653 | 7,055,518 |
| OK | VIEWCS1/services | 10,862,592 | 10,883,527 | 10,895,360 | -460,800 | 10,597 | 10,882,048 | 10,880,146 | 10,878,976 |
| OK | VIEWCS1/smss | 1,118,208 | 1,118,208 | 1,118,208 | 0 | 0 | 1,118,208 | 1,118,208 | 1,118,208 |
| OK | VIEWCS1/spoolsv | 13,152,256 | 13,154,076 | 13,168,640 | -460,800 | 5,298 | 13,152,256 | 13,152,256 | 13,152,256 |
| OK | VIEWCS1/svchost#1 | 7,991,296 | 8,069,575 | 8,122,368 | 1,036,800 | 39,159 | 8,062,976 | 8,054,491 | 8,050,530 |
| OK | VIEWCS1/svchost#10 | 5,505,024 | 5,505,024 | 5,505,024 | 0 | 0 | 5,505,024 | 5,505,024 | 5,505,024 |
| OK | VIEWCS1/svchost#11 | 4,435,968 | 4,435,968 | 4,435,968 | 0 | 0 | 4,435,968 | 4,435,968 | 4,435,968 |
| OK | VIEWCS1/svchost#2 | 13,328,384 | 13,333,845 | 13,352,960 | -691,200 | 10,513 | 13,331,456 | 13,328,384 | 13,328,384 |
| OK | VIEWCS1/svchost#3 | 31,555,584 | 31,810,446 | 31,932,416 | -10,368,000 | 142,470 | 31,795,712 | 31,780,279 | 31,770,782 |
| OK | VIEWCS1/svchost#4 | 11,542,528 | 11,550,720 | 11,558,912 | 460,800 | 8,429 | 11,549,696 | 11,548,379 | 11,547,569 |
| OK | VIEWCS1/svchost#5 | 11,010,048 | 11,010,048 | 11,010,048 | 0 | 0 | 11,010,048 | 11,010,048 | 11,010,048 |
| OK | VIEWCS1/svchost#6 | 17,690,624 | 17,773,909 | 17,809,408 | 2,419,200 | 29,869 | 17,769,472 | 17,763,767 | 17,761,831 |
| OK | VIEWCS1/svchost#7 | 13,344,768 | 13,354,098 | 13,365,248 | 345,600 | 7,923 | 13,352,704 | 13,350,912 | 13,350,124 |
| OK | VIEWCS1/svchost#8 | 2,711,552 | 2,711,552 | 2,711,552 | 0 | 0 | 2,711,552 | 2,711,552 | 2,711,552 |
| OK | VIEWCS1/svchost#9 | 8,863,744 | 8,876,487 | 8,892,416 | -806,400 | 11,230 | 8,874,496 | 8,872,521 | 8,871,306 |
| OK | VIEWCS1/svchost | 9,699,328 | 9,726,635 | 9,748,480 | -921,600 | 15,895 | 9,723,904 | 9,722,734 | 9,722,014 |
| OK | VIEWCS1/System | 311,296 | 311,296 | 311,296 | 0 | 0 | 311,296 | 311,296 | 311,296 |
| OK | VIEWCS1/taskeng | 4,947,968 | 4,970,951 | 4,984,832 | 691,200 | 12,339 | 4,969,216 | 4,966,985 | 4,965,612 |
| OK | VIEWCS1/taskhost | 6,053,888 | 6,053,888 | 6,053,888 | 0 | 0 | 6,053,888 | 6,053,888 | 6,053,888 |
| OK | VIEWCS1/ViewTopoSvc | 98,082,816 | 98,178,162 | 98,246,656 | -806,400 | 58,025 | 98,169,600 | 98,158,592 | 98,151,818 |
| OK | VIEWCS1/vmtoolsd#1 | 11,186,176 | 11,186,176 | 11,186,176 | 0 | 0 | 11,186,176 | 11,186,176 | 11,186,176 |
| OK | VIEWCS1/vmtoolsd | 14,225,408 | 14,260,452 | 14,270,464 | 115,200 | 15,015 | 14,259,200 | 14,257,883 | 14,257,231 |
| OK | VIEWCS1/VMwareTray | 5,693,440 | 5,733,490 | 5,754,880 | -1,728,000 | 29,186 | 5,730,816 | 5,727,378 | 5,725,263 |
| OK | VIEWCS1/vmware-usbarbitrator | 5,246,976 | 5,246,976 | 5,246,976 | 0 | 0 | 5,246,976 | 5,246,976 | 5,246,976 |
| OK | VIEWCS1/wininit | 4,390,912 | 4,390,912 | 4,390,912 | 0 | 0 | 4,390,912 | 4,390,912 | 4,390,912 |
| OK | VIEWCS1/winlogon#1 | 4,980,736 | 4,980,736 | 4,980,736 | 0 | 0 | 4,980,736 | 4,980,736 | 4,980,736 |
| OK | VIEWCS1/winlogon | 4,227,072 | 4,227,072 | 4,227,072 | 0 | 0 | 4,227,072 | 4,227,072 | 4,227,072 |
| OK | VIEWCS1/WmiApSrv | 7,024,640 | 7,103,602 | 7,122,944 | 2,073,600 | 22,514 | 7,101,184 | 7,098,661 | 7,097,423 |
| OK | VIEWCS1/WmiPrvSE#1 | 6,983,680 | 7,155,712 | 7,344,128 | -9,100,800 | 184,183 | 7,128,795 | 7,094,955 | 7,094,955 |
| OK | VIEWCS1/WmiPrvSE | 6,164,480 | 6,272,796 | 6,361,088 | 3,225,600 | 71,447 | 6,261,760 | 6,251,081 | 6,245,140 |
| OK | VIEWCS1/ws_ConnectionServer | 7,036,928 | 7,036,928 | 7,036,928 | 0 | 0 | 7,036,928 | 7,036,928 | 7,036,928 |
| OK | VIEWCS1/ws_MessageBusService | 211,431,424 | 212,182,812 | 212,537,344 | 27,648,000 | 384,499 | 212,139,264 | 212,091,758 | 212,066,619 |
| OK | VIEWCS1/ws_TomcatService | 342,073,344 | 344,798,549 | 350,351,360 | 10,598,400 | 1,596,012 | 344,414,720 | 344,332,288 | 344,289,280 |
| OK | VIEWCS1/ws_TunnelService | 187,023,360 | 188,258,759 | 188,739,584 | -43,430,400 | 682,813 | 188,202,752 | 188,135,424 | 188,095,567 |
| OK | VIEWCS1/wsnm | 22,376,448 | 22,414,222 | 22,437,888 | -460,800 | 23,109 | 22,411,264 | 22,407,461 | 22,405,435 |
Alerts
| An alert is generated if any of the thresholds were broken during one of the time ranges analyzed. The background of each of the values represents the highest priority threshold that the value broke. See each of the counter’s respective analysis section for more details about what the threshold means. |
| Time Range | ||||||
|---|---|---|---|---|---|---|
| 9/25/2012 11:30:36 AM – 9/25/2012 11:30:51 AM | Condition | Counter | Min | Avg | Max | Hourly Trend |
| The working set of all processes combined is increasing at a rate greater than 100MBs per hour | VIEWCS1Process(_Total)Working Set | 1,671,376,896 | 1,671,376,896 | 1,671,376,896 | 556,646,400 |
Process % Processor Time
Description: This analysis checks all of the processes to determine if any of the processes are consuming a large amount of CPU.
If a user-mode processor bottleneck is suspected, then consider using a process profiler to analyze the functions causing the high CPU consumption. See How To: Identify Functions causing a High User-mode CPU Bottleneck for Server Applications in a Production Environment article in the references section for more information.
Role Specific
– Process(MSExchangeMailboxAssistants*)%Processor Time should be less than 5% of overll CPU
– Process(msftefd*)%Processor Time should be less than 10% of what the store process is consuming. Note: If indexing is running and overall CPU is greater than 80%, then msfte should backoff it’s CPU usage if that threshold is hit.
References:
Measuring .NET Application Performance
https://msdn2.microsoft.com/en-us/library/ms998579.aspx
How To: Identify Functions causing a High User-mode CPU Bottleneck for Server Applications in a Production Environment https://www.codeplex.com/PerfTesting/Wiki/View.aspx?title=How%20To%3a%20Identify%20a%20Disk%20Performance%20Bottleneck%20Using%20SPA&referringTitle=How%20Tos


Overall Counter Instance Statistics
| Overall statistics of each of the counter instances. Min, Avg, and Max are the minimum, average, and Maximum values in the entire log. Hourly Trend is the calculated hourly slope of the entire log. 10%, 20%, and 30% of Outliers Removed is the average of the values after the percentage of outliers furthest away from the average have been removed. This is to help determine if a small percentage of the values are extreme which can skew the average. |
| Condition | Process(*)% Processor Time | Min | Avg | Max | Hourly Trend | Std Deviation | 10% of Outliers Removed | 20% of Outliers Removed | 30% of Outliers Removed |
|---|---|---|---|---|---|---|---|---|---|
| No Thresholds | VIEWCS1/avagent | 0 | 0 | 0 | 0 | 0 | 0 | 0 | 0 |
| No Thresholds | VIEWCS1/avscc | 0 | 0 | 0 | 0 | 0 | 0 | 0 | 0 |
| No Thresholds | VIEWCS1/csrss#1 | 0 | 0 | 0 | 0 | 0 | 0 | 0 | 0 |
| No Thresholds | VIEWCS1/csrss#2 | 0 | 0 | 0 | 0 | 0 | 0 | 0 | 0 |
| No Thresholds | VIEWCS1/csrss | 0 | 0 | 0 | 0 | 0 | 0 | 0 | 0 |
| No Thresholds | VIEWCS1/dllhost#1 | – | – | – | – | – | – | – | – |
| No Thresholds | VIEWCS1/dllhost | 0 | 0 | 0 | 0 | 0 | 0 | 0 | 0 |
| No Thresholds | VIEWCS1/dsamain | 0 | 0 | 1 | 0 | 0 | 0 | 0 | 0 |
| No Thresholds | VIEWCS1/dwm | 0 | 0 | 0 | 0 | 0 | 0 | 0 | 0 |
| No Thresholds | VIEWCS1/explorer | 0 | 0 | 0 | 0 | 0 | 0 | 0 | 0 |
| No Thresholds | VIEWCS1/FlashUtil32_11_4_402_278_ActiveX | 0 | 0 | 0 | 0 | 0 | 0 | 0 | 0 |
| No Thresholds | VIEWCS1/iexplore#1 | 0 | 0 | 0 | 0 | 0 | 0 | 0 | 0 |
| No Thresholds | VIEWCS1/iexplore#2 | 0 | 0 | 1 | 0 | 0 | 0 | 0 | 0 |
| No Thresholds | VIEWCS1/iexplore#3 | 0 | 0 | 0 | 0 | 0 | 0 | 0 | 0 |
| No Thresholds | VIEWCS1/iexplore | 0 | 0 | 0 | 0 | 0 | 0 | 0 | 0 |
| No Thresholds | VIEWCS1/LogonUI | 0 | 0 | 0 | 0 | 0 | 0 | 0 | 0 |
| No Thresholds | VIEWCS1/lsass | 0 | 0 | 0 | 0 | 0 | 0 | 0 | 0 |
| No Thresholds | VIEWCS1/lsm | 0 | 0 | 0 | 0 | 0 | 0 | 0 | 0 |
| No Thresholds | VIEWCS1/Microsoft.ActiveDirectory.WebServices | 0 | 0 | 0 | 0 | 0 | 0 | 0 | 0 |
| No Thresholds | VIEWCS1/mmc#1 | 0 | 0 | 0 | 0 | 0 | 0 | 0 | 0 |
| No Thresholds | VIEWCS1/mmc#2 | 0 | 0 | 2 | 56 | 1 | 0 | 0 | 0 |
| No Thresholds | VIEWCS1/mmc | 0 | 0 | 0 | 0 | 0 | 0 | 0 | 0 |
| No Thresholds | VIEWCS1/msdtc | 0 | 0 | 0 | 0 | 0 | 0 | 0 | 0 |
| No Thresholds | VIEWCS1/rdpclip | 0 | 0 | 0 | 0 | 0 | 0 | 0 | 0 |
| No Thresholds | VIEWCS1/rundll32 | 0 | 0 | 0 | 0 | 0 | 0 | 0 | 0 |
| No Thresholds | VIEWCS1/SecurityGateway | 0 | 0 | 0 | 0 | 0 | 0 | 0 | 0 |
| No Thresholds | VIEWCS1/services | 0 | 0 | 0 | 0 | 0 | 0 | 0 | 0 |
| No Thresholds | VIEWCS1/smss | 0 | 0 | 0 | 0 | 0 | 0 | 0 | 0 |
| No Thresholds | VIEWCS1/spoolsv | 0 | 0 | 0 | 0 | 0 | 0 | 0 | 0 |
| No Thresholds | VIEWCS1/svchost#1 | 0 | 0 | 0 | 0 | 0 | 0 | 0 | 0 |
| No Thresholds | VIEWCS1/svchost#10 | 0 | 0 | 0 | 0 | 0 | 0 | 0 | 0 |
| No Thresholds | VIEWCS1/svchost#11 | 0 | 0 | 0 | 0 | 0 | 0 | 0 | 0 |
| No Thresholds | VIEWCS1/svchost#2 | 0 | 0 | 0 | 0 | 0 | 0 | 0 | 0 |
| No Thresholds | VIEWCS1/svchost#3 | 0 | 0 | 0 | 0 | 0 | 0 | 0 | 0 |
| No Thresholds | VIEWCS1/svchost#4 | 0 | 0 | 0 | 0 | 0 | 0 | 0 | 0 |
| No Thresholds | VIEWCS1/svchost#5 | 0 | 0 | 0 | 0 | 0 | 0 | 0 | 0 |
| No Thresholds | VIEWCS1/svchost#6 | 0 | 0 | 0 | 0 | 0 | 0 | 0 | 0 |
| No Thresholds | VIEWCS1/svchost#7 | 0 | 0 | 0 | 0 | 0 | 0 | 0 | 0 |
| No Thresholds | VIEWCS1/svchost#8 | 0 | 0 | 0 | 0 | 0 | 0 | 0 | 0 |
| No Thresholds | VIEWCS1/svchost#9 | 0 | 0 | 0 | 0 | 0 | 0 | 0 | 0 |
| No Thresholds | VIEWCS1/svchost | 0 | 0 | 0 | 0 | 0 | 0 | 0 | 0 |
| No Thresholds | VIEWCS1/System | 0 | 0 | 0 | 0 | 0 | 0 | 0 | 0 |
| No Thresholds | VIEWCS1/taskeng | 0 | 0 | 0 | 0 | 0 | 0 | 0 | 0 |
| No Thresholds | VIEWCS1/taskhost | 0 | 0 | 0 | 0 | 0 | 0 | 0 | 0 |
| No Thresholds | VIEWCS1/ViewTopoSvc | 0 | 0 | 0 | 0 | 0 | 0 | 0 | 0 |
| No Thresholds | VIEWCS1/vmtoolsd#1 | 0 | 0 | 0 | 0 | 0 | 0 | 0 | 0 |
| No Thresholds | VIEWCS1/vmtoolsd | 0 | 0 | 0 | 0 | 0 | 0 | 0 | 0 |
| No Thresholds | VIEWCS1/VMwareTray | 0 | 0 | 0 | 0 | 0 | 0 | 0 | 0 |
| No Thresholds | VIEWCS1/vmware-usbarbitrator | 0 | 0 | 0 | 0 | 0 | 0 | 0 | 0 |
| No Thresholds | VIEWCS1/wininit | 0 | 0 | 0 | 0 | 0 | 0 | 0 | 0 |
| No Thresholds | VIEWCS1/winlogon#1 | 0 | 0 | 0 | 0 | 0 | 0 | 0 | 0 |
| No Thresholds | VIEWCS1/winlogon | 0 | 0 | 0 | 0 | 0 | 0 | 0 | 0 |
| No Thresholds | VIEWCS1/WmiApSrv | 0 | 0 | 0 | 0 | 0 | 0 | 0 | 0 |
| No Thresholds | VIEWCS1/WmiPrvSE#1 | 0 | 0 | 0 | 0 | 0 | 0 | 0 | 0 |
| No Thresholds | VIEWCS1/WmiPrvSE | 0 | 0 | 0 | 0 | 0 | 0 | 0 | 0 |
| No Thresholds | VIEWCS1/ws_ConnectionServer | 0 | 0 | 0 | 0 | 0 | 0 | 0 | 0 |
| No Thresholds | VIEWCS1/ws_MessageBusService | 0 | 0 | 1 | -28 | 0 | 0 | 0 | 0 |
| No Thresholds | VIEWCS1/ws_TomcatService | 0 | 1 | 5 | 28 | 1 | 1 | 1 | 0 |
| No Thresholds | VIEWCS1/ws_TunnelService | 0 | 0 | 0 | 0 | 0 | 0 | 0 | 0 |
| No Thresholds | VIEWCS1/wsnm | 0 | 0 | 0 | 0 | 0 | 0 | 0 | 0 |
Alerts
| An alert is generated if any of the thresholds were broken during one of the time ranges analyzed. The background of each of the values represents the highest priority threshold that the value broke. See each of the counter’s respective analysis section for more details about what the threshold means. |
| No Alerts Found |
|---|
Process Virtual Bytes
Description: This analysis determines if any of the processes are consuming a large of virtual memory. 32-bit processes by default are only allowed to access up to 2 GB of user mode memory. If the process becomes close to this maximum, then it could starve for memory. If a process is becoming close to it’s maximum, then consider moving the process to a 64-bit system. On 32-bit Windows and Windows Server, the /3GB switch could be used to give user mode processes up to 3 GB of addressable memory, but this takes away 1 GB of memory from the kernel which could have worse affects on the entire system such as with Pool Paged Memory and Pool Non-Paged Memory. On x64 (64-bit implementation) Windows and Windows Server, 32-bit processes that are large address aware can address up to 4 GB of virtual address space each and 64-bit processes can address up to 8 TB of virtual address space each. It is important that processes have plenty of virtual address space.


Overall Counter Instance Statistics
| Overall statistics of each of the counter instances. Min, Avg, and Max are the minimum, average, and Maximum values in the entire log. Hourly Trend is the calculated hourly slope of the entire log. 10%, 20%, and 30% of Outliers Removed is the average of the values after the percentage of outliers furthest away from the average have been removed. This is to help determine if a small percentage of the values are extreme which can skew the average. |
| Condition | Process(*)Virtual Bytes | Min | Avg | Max | Hourly Trend | Std Deviation | 10% of Outliers Removed | 20% of Outliers Removed | 30% of Outliers Removed |
|---|---|---|---|---|---|---|---|---|---|
| OK | VIEWCS1/avagent | 64,262,144 | 66,359,296 | 67,407,872 | 0 | 804,221 | 66,228,224 | 66,059,703 | 66,036,657 |
| OK | VIEWCS1/avscc | 114,884,608 | 114,884,608 | 114,884,608 | 0 | 0 | 114,884,608 | 114,884,608 | 114,884,608 |
| OK | VIEWCS1/csrss#1 | 50,503,680 | 50,503,680 | 50,503,680 | 0 | 0 | 50,503,680 | 50,503,680 | 50,503,680 |
| OK | VIEWCS1/csrss#2 | 50,835,456 | 50,929,209 | 51,679,232 | -23,731,200 | 272,861 | 50,835,456 | 50,835,456 | 50,835,456 |
| OK | VIEWCS1/csrss | 49,827,840 | 49,860,608 | 49,958,912 | -1,843,200 | 40,524 | 49,852,416 | 49,846,565 | 49,842,964 |
| OK | VIEWCS1/dllhost#1 | 47,697,920 | 47,697,920 | 47,697,920 | 0 | 0 | 47,697,920 | 47,697,920 | 47,697,920 |
| OK | VIEWCS1/dllhost | 59,035,648 | 59,035,648 | 59,035,648 | 0 | 0 | 59,035,648 | 59,035,648 | 59,035,648 |
| OK | VIEWCS1/dsamain | 251,039,744 | 251,360,142 | 251,564,032 | 14,745,600 | 262,999 | 251,334,656 | 251,301,888 | 251,281,723 |
| OK | VIEWCS1/dwm | 56,180,736 | 56,180,736 | 56,180,736 | 0 | 0 | 56,180,736 | 56,180,736 | 56,180,736 |
| OK | VIEWCS1/explorer | 189,968,384 | 191,282,517 | 199,249,920 | -246,297,600 | 2,215,720 | 190,689,280 | 190,492,672 | 190,371,682 |
| OK | VIEWCS1/FlashUtil32_11_4_402_278_ActiveX | 99,340,288 | 99,340,288 | 99,340,288 | 0 | 0 | 99,340,288 | 99,340,288 | 99,340,288 |
| OK | VIEWCS1/Idle | 0 | 0 | 0 | 0 | 0 | 0 | 0 | 0 |
| OK | VIEWCS1/iexplore#1 | 241,725,440 | 241,725,440 | 241,725,440 | 0 | 0 | 241,725,440 | 241,725,440 | 241,725,440 |
| OK | VIEWCS1/iexplore#2 | 172,167,168 | 172,463,900 | 173,494,272 | 460,800 | 562,272 | 172,335,104 | 172,171,849 | 172,170,949 |
| OK | VIEWCS1/iexplore#3 | 210,698,240 | 210,698,240 | 210,698,240 | 0 | 0 | 210,698,240 | 210,698,240 | 210,698,240 |
| OK | VIEWCS1/iexplore | 189,034,496 | 190,272,398 | 190,345,216 | 0 | 308,940 | 190,263,296 | 190,251,593 | 190,244,391 |
| OK | VIEWCS1/LogonUI | 90,263,552 | 90,263,552 | 90,263,552 | 0 | 0 | 90,263,552 | 90,263,552 | 90,263,552 |
| OK | VIEWCS1/lsass | 53,276,672 | 53,364,053 | 53,800,960 | -14,745,600 | 201,055 | 53,309,440 | 53,276,672 | 53,276,672 |
| OK | VIEWCS1/lsm | 30,601,216 | 30,979,868 | 31,125,504 | -14,745,600 | 241,638 | 30,961,664 | 30,938,258 | 30,923,855 |
| OK | VIEWCS1/Microsoft.ActiveDirectory.WebServices | 576,192,512 | 576,309,020 | 577,241,088 | 0 | 339,089 | 576,192,512 | 576,192,512 | 576,192,512 |
| OK | VIEWCS1/mmc#1 | 641,236,992 | 641,236,992 | 641,236,992 | 0 | 0 | 641,236,992 | 641,236,992 | 641,236,992 |
| OK | VIEWCS1/mmc#2 | 204,902,400 | 205,691,108 | 209,117,184 | -118,540,800 | 1,268,519 | 205,262,848 | 205,239,442 | 205,225,039 |
| OK | VIEWCS1/mmc | 153,575,424 | 153,575,424 | 153,575,424 | 0 | 0 | 153,575,424 | 153,575,424 | 153,575,424 |
| OK | VIEWCS1/msdtc | 63,352,832 | 63,352,832 | 63,352,832 | 0 | 0 | 63,352,832 | 63,352,832 | 63,352,832 |
| OK | VIEWCS1/rdpclip | 63,074,304 | 63,511,211 | 64,122,880 | 0 | 449,573 | 63,434,752 | 63,336,448 | 63,275,953 |
| OK | VIEWCS1/rundll32 | 84,914,176 | 85,554,972 | 85,962,752 | 29,491,200 | 494,303 | 85,504,000 | 85,438,464 | 85,398,134 |
| OK | VIEWCS1/SecurityGateway | 38,797,312 | 38,797,312 | 38,797,312 | 0 | 0 | 38,797,312 | 38,797,312 | 38,797,312 |
| OK | VIEWCS1/services | 48,963,584 | 49,400,491 | 49,487,872 | 0 | 201,055 | 49,389,568 | 49,375,525 | 49,366,882 |
| OK | VIEWCS1/smss | 5,693,440 | 5,693,440 | 5,693,440 | 0 | 0 | 5,693,440 | 5,693,440 | 5,693,440 |
| OK | VIEWCS1/spoolsv | 103,141,376 | 103,170,503 | 103,403,520 | -7,372,800 | 84,772 | 103,141,376 | 103,141,376 | 103,141,376 |
| OK | VIEWCS1/svchost#1 | 39,780,352 | 40,508,530 | 41,353,216 | -29,491,200 | 626,542 | 40,402,944 | 40,267,191 | 40,183,650 |
| OK | VIEWCS1/svchost#10 | 35,287,040 | 35,287,040 | 35,287,040 | 0 | 0 | 35,287,040 | 35,287,040 | 35,287,040 |
| OK | VIEWCS1/svchost#11 | 34,508,800 | 34,508,800 | 34,508,800 | 0 | 0 | 34,508,800 | 34,508,800 | 34,508,800 |
| OK | VIEWCS1/svchost#2 | 52,346,880 | 52,463,388 | 52,871,168 | -14,745,600 | 224,287 | 52,412,416 | 52,346,880 | 52,346,880 |
| OK | VIEWCS1/svchost#3 | 126,992,384 | 127,254,528 | 128,040,960 | -29,491,200 | 370,728 | 127,156,224 | 127,104,731 | 127,073,044 |
| OK | VIEWCS1/svchost#4 | 48,283,648 | 48,545,792 | 48,807,936 | 14,745,600 | 269,744 | 48,513,024 | 48,470,894 | 48,444,967 |
| OK | VIEWCS1/svchost#5 | 72,105,984 | 72,105,984 | 72,105,984 | 0 | 0 | 72,105,984 | 72,105,984 | 72,105,984 |
| OK | VIEWCS1/svchost#6 | 156,819,456 | 157,872,583 | 158,412,800 | 14,745,600 | 481,144 | 157,805,056 | 157,718,235 | 157,666,383 |
| OK | VIEWCS1/svchost#7 | 61,943,808 | 62,089,444 | 62,468,096 | 0 | 241,638 | 62,042,112 | 61,981,257 | 61,943,808 |
| OK | VIEWCS1/svchost#8 | 13,312,000 | 13,312,000 | 13,312,000 | 0 | 0 | 13,312,000 | 13,312,000 | 13,312,000 |
| OK | VIEWCS1/svchost#9 | 44,367,872 | 44,571,762 | 44,892,160 | -14,745,600 | 262,999 | 44,531,712 | 44,480,219 | 44,448,532 |
| OK | VIEWCS1/svchost | 47,734,784 | 48,288,199 | 48,783,360 | -29,491,200 | 380,296 | 48,226,304 | 48,146,725 | 48,097,753 |
| OK | VIEWCS1/System | 3,461,120 | 3,461,120 | 3,461,120 | 0 | 0 | 3,461,120 | 3,461,120 | 3,461,120 |
| OK | VIEWCS1/taskeng | 34,287,616 | 35,015,794 | 35,336,192 | -14,745,600 | 365,849 | 34,975,744 | 34,924,251 | 34,892,564 |
| OK | VIEWCS1/taskhost | 57,524,224 | 57,524,224 | 57,524,224 | 0 | 0 | 57,524,224 | 57,524,224 | 57,524,224 |
| Greater than 75 percent of estimated process virtual address space | VIEWCS1/ViewTopoSvc | 2,937,270,272 | 2,940,998,542 | 2,943,561,728 | -29,491,200 | 2,103,994 | 2,940,678,144 | 2,940,266,203 | 2,940,012,702 |
| OK | VIEWCS1/vmtoolsd#1 | 95,162,368 | 95,162,368 | 95,162,368 | 0 | 0 | 95,162,368 | 95,162,368 | 95,162,368 |
| OK | VIEWCS1/vmtoolsd | 106,856,448 | 108,604,075 | 108,953,600 | 0 | 804,221 | 108,560,384 | 108,504,210 | 108,469,642 |
| OK | VIEWCS1/VMwareTray | 73,052,160 | 75,149,312 | 76,197,888 | -88,473,600 | 1,525,902 | 75,018,240 | 74,849,719 | 74,746,014 |
| OK | VIEWCS1/vmware-usbarbitrator | 54,063,104 | 54,063,104 | 54,063,104 | 0 | 0 | 54,063,104 | 54,063,104 | 54,063,104 |
| OK | VIEWCS1/wininit | 50,532,352 | 50,532,352 | 50,532,352 | 0 | 0 | 50,532,352 | 50,532,352 | 50,532,352 |
| OK | VIEWCS1/winlogon#1 | 32,849,920 | 32,849,920 | 32,849,920 | 0 | 0 | 32,849,920 | 32,849,920 | 32,849,920 |
| OK | VIEWCS1/winlogon | 26,632,192 | 26,632,192 | 26,632,192 | 0 | 0 | 26,632,192 | 26,632,192 | 26,632,192 |
| OK | VIEWCS1/WmiApSrv | 34,504,704 | 35,116,373 | 35,553,280 | -29,491,200 | 412,041 | 35,061,760 | 34,991,543 | 34,948,332 |
| OK | VIEWCS1/WmiPrvSE#1 | 42,414,080 | 43,031,552 | 43,782,144 | -38,246,400 | 681,829 | 42,924,325 | 42,781,355 | 42,781,355 |
| OK | VIEWCS1/WmiPrvSE | 36,782,080 | 37,441,536 | 37,892,096 | -31,219,200 | 429,376 | 37,385,216 | 37,312,805 | 37,268,244 |
| OK | VIEWCS1/ws_ConnectionServer | 67,309,568 | 67,309,568 | 67,309,568 | 0 | 0 | 67,309,568 | 67,309,568 | 67,309,568 |
| OK | VIEWCS1/ws_MessageBusService | 1,597,943,808 | 1,601,555,570 | 1,604,235,264 | -117,964,800 | 2,497,549 | 1,601,220,608 | 1,600,789,943 | 1,600,524,918 |
| Greater than 75 percent of estimated process virtual address space | VIEWCS1/ws_TomcatService | 1,614,323,712 | 1,619,042,304 | 1,625,858,048 | 147,456,000 | 3,078,182 | 1,618,190,336 | 1,617,918,830 | 1,617,792,079 |
| OK | VIEWCS1/ws_TunnelService | 1,114,841,088 | 1,116,297,444 | 1,117,986,816 | -29,491,200 | 1,531,778 | 1,116,086,272 | 1,115,814,766 | 1,115,647,685 |
| OK | VIEWCS1/wsnm | 157,360,128 | 159,690,297 | 160,505,856 | 58,982,400 | 1,051,997 | 159,588,352 | 159,457,280 | 159,376,620 |
Alerts
| An alert is generated if any of the thresholds were broken during one of the time ranges analyzed. The background of each of the values represents the highest priority threshold that the value broke. See each of the counter’s respective analysis section for more details about what the threshold means. |
| Time Range | ||||||
|---|---|---|---|---|---|---|
| 9/25/2012 11:29:51 AM – 9/25/2012 11:30:06 AM | Condition | Counter | Min | Avg | Max | Hourly Trend |
| Greater than 75 percent of estimated process virtual address space | VIEWCS1Process(ViewTopoSvc)Virtual Bytes | 2,939,367,424 | 2,939,367,424 | 2,939,367,424 | 0 | |
| Greater than 75 percent of estimated process virtual address space | VIEWCS1Process(ws_TomcatService)Virtual Bytes | 1,620,615,168 | 1,620,615,168 | 1,620,615,168 | 0 | |
| 9/25/2012 11:30:06 AM – 9/25/2012 11:30:21 AM | Condition | Counter | Min | Avg | Max | Hourly Trend |
| Greater than 75 percent of estimated process virtual address space | VIEWCS1Process(ViewTopoSvc)Virtual Bytes | 2,939,367,424 | 2,939,367,424 | 2,939,367,424 | 0 | |
| Greater than 75 percent of estimated process virtual address space | VIEWCS1Process(ws_TomcatService)Virtual Bytes | 1,618,518,016 | 1,618,518,016 | 1,618,518,016 | -943,718,400 | |
| 9/25/2012 11:30:21 AM – 9/25/2012 11:30:36 AM | Condition | Counter | Min | Avg | Max | Hourly Trend |
| Greater than 75 percent of estimated process virtual address space | VIEWCS1Process(ViewTopoSvc)Virtual Bytes | 2,939,367,424 | 2,939,367,424 | 2,939,367,424 | 0 | |
| Greater than 75 percent of estimated process virtual address space | VIEWCS1Process(ws_TomcatService)Virtual Bytes | 1,618,518,016 | 1,618,518,016 | 1,618,518,016 | -471,859,200 | |
| 9/25/2012 11:30:36 AM – 9/25/2012 11:30:51 AM | Condition | Counter | Min | Avg | Max | Hourly Trend |
| Greater than 75 percent of estimated process virtual address space | VIEWCS1Process(ViewTopoSvc)Virtual Bytes | 2,943,561,728 | 2,943,561,728 | 2,943,561,728 | 629,145,600 | |
| Greater than 75 percent of estimated process virtual address space | VIEWCS1Process(ws_TomcatService)Virtual Bytes | 1,619,566,592 | 1,619,566,592 | 1,619,566,592 | -157,286,400 | |
| 9/25/2012 11:30:51 AM – 9/25/2012 11:31:06 AM | Condition | Counter | Min | Avg | Max | Hourly Trend |
| Greater than 75 percent of estimated process virtual address space | VIEWCS1Process(ViewTopoSvc)Virtual Bytes | 2,943,561,728 | 2,943,561,728 | 2,943,561,728 | 471,859,200 | |
| Greater than 75 percent of estimated process virtual address space | VIEWCS1Process(ws_TomcatService)Virtual Bytes | 1,619,566,592 | 1,619,566,592 | 1,619,566,592 | -117,964,800 | |
| 9/25/2012 11:31:06 AM – 9/25/2012 11:31:21 AM | Condition | Counter | Min | Avg | Max | Hourly Trend |
| Greater than 75 percent of estimated process virtual address space | VIEWCS1Process(ViewTopoSvc)Virtual Bytes | 2,943,561,728 | 2,943,561,728 | 2,943,561,728 | 377,487,360 | |
| Greater than 75 percent of estimated process virtual address space | VIEWCS1Process(ws_TomcatService)Virtual Bytes | 1,619,566,592 | 1,619,566,592 | 1,619,566,592 | -94,371,840 | |
| 9/25/2012 11:31:21 AM – 9/25/2012 11:31:36 AM | Condition | Counter | Min | Avg | Max | Hourly Trend |
| Greater than 75 percent of estimated process virtual address space | VIEWCS1Process(ViewTopoSvc)Virtual Bytes | 2,943,561,728 | 2,943,561,728 | 2,943,561,728 | 314,572,800 | |
| Greater than 75 percent of estimated process virtual address space | VIEWCS1Process(ws_TomcatService)Virtual Bytes | 1,619,566,592 | 1,619,566,592 | 1,619,566,592 | -78,643,200 | |
| 9/25/2012 11:31:36 AM – 9/25/2012 11:31:51 AM | Condition | Counter | Min | Avg | Max | Hourly Trend |
| Greater than 75 percent of estimated process virtual address space | VIEWCS1Process(ViewTopoSvc)Virtual Bytes | 2,943,561,728 | 2,943,561,728 | 2,943,561,728 | 269,633,829 | |
| Greater than 75 percent of estimated process virtual address space | VIEWCS1Process(ws_TomcatService)Virtual Bytes | 1,617,469,440 | 1,617,469,440 | 1,617,469,440 | -202,225,371 | |
| 9/25/2012 11:31:51 AM – 9/25/2012 11:32:06 AM | Condition | Counter | Min | Avg | Max | Hourly Trend |
| Greater than 75 percent of estimated process virtual address space | VIEWCS1Process(ViewTopoSvc)Virtual Bytes | 2,941,464,576 | 2,941,464,576 | 2,941,464,576 | 117,964,800 | |
| Greater than 75 percent of estimated process virtual address space | VIEWCS1Process(ws_TomcatService)Virtual Bytes | 1,617,469,440 | 1,617,469,440 | 1,617,469,440 | -176,947,200 | |
| 9/25/2012 11:32:06 AM – 9/25/2012 11:32:21 AM | Condition | Counter | Min | Avg | Max | Hourly Trend |
| Greater than 75 percent of estimated process virtual address space | VIEWCS1Process(ViewTopoSvc)Virtual Bytes | 2,942,513,152 | 2,942,513,152 | 2,942,513,152 | 157,286,400 | |
| Greater than 75 percent of estimated process virtual address space | VIEWCS1Process(ws_TomcatService)Virtual Bytes | 1,619,566,592 | 1,619,566,592 | 1,619,566,592 | -52,428,800 | |
| 9/25/2012 11:32:21 AM – 9/25/2012 11:32:36 AM | Condition | Counter | Min | Avg | Max | Hourly Trend |
| Greater than 75 percent of estimated process virtual address space | VIEWCS1Process(ViewTopoSvc)Virtual Bytes | 2,942,513,152 | 2,942,513,152 | 2,942,513,152 | 141,557,760 | |
| Greater than 75 percent of estimated process virtual address space | VIEWCS1Process(ws_TomcatService)Virtual Bytes | 1,619,566,592 | 1,619,566,592 | 1,619,566,592 | -47,185,920 | |
| 9/25/2012 11:32:36 AM – 9/25/2012 11:32:51 AM | Condition | Counter | Min | Avg | Max | Hourly Trend |
| Greater than 75 percent of estimated process virtual address space | VIEWCS1Process(ViewTopoSvc)Virtual Bytes | 2,941,464,576 | 2,941,464,576 | 2,941,464,576 | 85,792,582 | |
| Greater than 75 percent of estimated process virtual address space | VIEWCS1Process(ws_TomcatService)Virtual Bytes | 1,619,566,592 | 1,619,566,592 | 1,619,566,592 | -42,896,291 | |
| 9/25/2012 11:32:51 AM – 9/25/2012 11:33:06 AM | Condition | Counter | Min | Avg | Max | Hourly Trend |
| Greater than 75 percent of estimated process virtual address space | VIEWCS1Process(ViewTopoSvc)Virtual Bytes | 2,939,367,424 | 2,939,367,424 | 2,939,367,424 | 0 | |
| Greater than 75 percent of estimated process virtual address space | VIEWCS1Process(ws_TomcatService)Virtual Bytes | 1,616,420,864 | 1,616,420,864 | 1,616,420,864 | -157,286,400 | |
| 9/25/2012 11:33:06 AM – 9/25/2012 11:33:21 AM | Condition | Counter | Min | Avg | Max | Hourly Trend |
| Greater than 75 percent of estimated process virtual address space | VIEWCS1Process(ViewTopoSvc)Virtual Bytes | 2,939,367,424 | 2,939,367,424 | 2,939,367,424 | 0 | |
| Greater than 75 percent of estimated process virtual address space | VIEWCS1Process(ws_TomcatService)Virtual Bytes | 1,614,323,712 | 1,614,323,712 | 1,614,323,712 | -217,781,169 | |
| 9/25/2012 11:33:21 AM – 9/25/2012 11:33:36 AM | Condition | Counter | Min | Avg | Max | Hourly Trend |
| Greater than 75 percent of estimated process virtual address space | VIEWCS1Process(ViewTopoSvc)Virtual Bytes | 2,937,270,272 | 2,937,270,272 | 2,937,270,272 | -67,408,457 | |
| Greater than 75 percent of estimated process virtual address space | VIEWCS1Process(ws_TomcatService)Virtual Bytes | 1,614,323,712 | 1,614,323,712 | 1,614,323,712 | -202,225,371 | |
| 9/25/2012 11:33:36 AM – 9/25/2012 11:33:51 AM | Condition | Counter | Min | Avg | Max | Hourly Trend |
| Greater than 75 percent of estimated process virtual address space | VIEWCS1Process(ViewTopoSvc)Virtual Bytes | 2,939,367,424 | 2,939,367,424 | 2,939,367,424 | 0 | |
| Greater than 75 percent of estimated process virtual address space | VIEWCS1Process(ws_TomcatService)Virtual Bytes | 1,616,420,864 | 1,616,420,864 | 1,616,420,864 | -125,829,120 | |
| 9/25/2012 11:33:51 AM – 9/25/2012 11:33:59 AM | Condition | Counter | Min | Avg | Max | Hourly Trend |
| Greater than 75 percent of estimated process virtual address space | VIEWCS1Process(ViewTopoSvc)Virtual Bytes | 2,938,318,848 | 2,938,318,848 | 2,938,318,848 | -29,491,200 | |
| Greater than 75 percent of estimated process virtual address space | VIEWCS1Process(ws_TomcatService)Virtual Bytes | 1,625,858,048 | 1,625,858,048 | 1,625,858,048 | 147,456,000 |
Process IO Data Operations/sec
Description: The rate at which the process is issuing read and write I/O operations. This counter counts all I/O activity generated by the process to include file, network and device I/Os.


Overall Counter Instance Statistics
| Overall statistics of each of the counter instances. Min, Avg, and Max are the minimum, average, and Maximum values in the entire log. Hourly Trend is the calculated hourly slope of the entire log. 10%, 20%, and 30% of Outliers Removed is the average of the values after the percentage of outliers furthest away from the average have been removed. This is to help determine if a small percentage of the values are extreme which can skew the average. |
| Condition | Process(*)IO Data Operations/sec | Min | Avg | Max | Hourly Trend | Std Deviation | 10% of Outliers Removed | 20% of Outliers Removed | 30% of Outliers Removed |
|---|---|---|---|---|---|---|---|---|---|
| OK | VIEWCS1/avagent | 0 | 0 | 3 | -84 | 1 | 0 | 0 | 0 |
| OK | VIEWCS1/avscc | 0 | 0 | 0 | 0 | 0 | 0 | 0 | 0 |
| OK | VIEWCS1/csrss#1 | 0 | 0 | 0 | 0 | 0 | 0 | 0 | 0 |
| OK | VIEWCS1/csrss#2 | 0 | 0 | 1 | 0 | 0 | 0 | 0 | 0 |
| OK | VIEWCS1/csrss | 0 | 0 | 0 | 0 | 0 | 0 | 0 | 0 |
| OK | VIEWCS1/dllhost#1 | – | – | – | – | – | – | – | – |
| OK | VIEWCS1/dllhost | 0 | 0 | 0 | 0 | 0 | 0 | 0 | 0 |
| OK | VIEWCS1/dsamain | 0 | 1 | 2 | 0 | 1 | 0 | 0 | 0 |
| OK | VIEWCS1/dwm | 0 | 0 | 0 | 0 | 0 | 0 | 0 | 0 |
| OK | VIEWCS1/explorer | 0 | 1 | 1 | 0 | 1 | 1 | 1 | 1 |
| OK | VIEWCS1/FlashUtil32_11_4_402_278_ActiveX | 0 | 0 | 0 | 0 | 0 | 0 | 0 | 0 |
| OK | VIEWCS1/Idle | 0 | 0 | 0 | 0 | 0 | 0 | 0 | 0 |
| OK | VIEWCS1/iexplore#1 | 0 | 0 | 0 | 0 | 0 | 0 | 0 | 0 |
| OK | VIEWCS1/iexplore#2 | 0 | 0 | 0 | 0 | 0 | 0 | 0 | 0 |
| OK | VIEWCS1/iexplore#3 | 0 | 0 | 0 | 0 | 0 | 0 | 0 | 0 |
| OK | VIEWCS1/iexplore | 1 | 2 | 3 | 0 | 1 | 2 | 2 | 2 |
| OK | VIEWCS1/LogonUI | 0 | 0 | 0 | 0 | 0 | 0 | 0 | 0 |
| OK | VIEWCS1/lsass | 0 | 0 | 2 | 0 | 1 | 0 | 0 | 0 |
| OK | VIEWCS1/lsm | 0 | 0 | 0 | 0 | 0 | 0 | 0 | 0 |
| OK | VIEWCS1/Microsoft.ActiveDirectory.WebServices | 0 | 0 | 0 | 0 | 0 | 0 | 0 | 0 |
| OK | VIEWCS1/mmc#1 | 0 | 0 | 0 | 0 | 0 | 0 | 0 | 0 |
| OK | VIEWCS1/mmc#2 | 0 | 0 | 0 | 0 | 0 | 0 | 0 | 0 |
| OK | VIEWCS1/mmc | 0 | 0 | 0 | 0 | 0 | 0 | 0 | 0 |
| OK | VIEWCS1/msdtc | 0 | 0 | 0 | 0 | 0 | 0 | 0 | 0 |
| OK | VIEWCS1/rdpclip | 0 | 0 | 0 | 0 | 0 | 0 | 0 | 0 |
| OK | VIEWCS1/rundll32 | 0 | 0 | 0 | 0 | 0 | 0 | 0 | 0 |
| OK | VIEWCS1/SecurityGateway | 1 | 1 | 2 | 0 | 0 | 1 | 1 | 1 |
| OK | VIEWCS1/services | 0 | 0 | 0 | 0 | 0 | 0 | 0 | 0 |
| OK | VIEWCS1/smss | 0 | 0 | 0 | 0 | 0 | 0 | 0 | 0 |
| OK | VIEWCS1/spoolsv | 0 | 0 | 0 | 0 | 0 | 0 | 0 | 0 |
| OK | VIEWCS1/svchost#1 | 0 | 0 | 0 | 0 | 0 | 0 | 0 | 0 |
| OK | VIEWCS1/svchost#10 | 0 | 0 | 0 | 0 | 0 | 0 | 0 | 0 |
| OK | VIEWCS1/svchost#11 | 0 | 0 | 0 | 0 | 0 | 0 | 0 | 0 |
| OK | VIEWCS1/svchost#2 | 0 | 0 | 1 | 0 | 0 | 0 | 0 | 0 |
| OK | VIEWCS1/svchost#3 | 0 | 0 | 1 | 0 | 0 | 0 | 0 | 0 |
| OK | VIEWCS1/svchost#4 | 0 | 0 | 0 | 0 | 0 | 0 | 0 | 0 |
| OK | VIEWCS1/svchost#5 | 0 | 0 | 0 | 0 | 0 | 0 | 0 | 0 |
| OK | VIEWCS1/svchost#6 | 0 | 0 | 1 | 0 | 0 | 0 | 0 | 0 |
| OK | VIEWCS1/svchost#7 | 0 | 0 | 0 | 0 | 0 | 0 | 0 | 0 |
| OK | VIEWCS1/svchost#8 | 0 | 0 | 0 | 0 | 0 | 0 | 0 | 0 |
| OK | VIEWCS1/svchost#9 | 0 | 0 | 0 | 0 | 0 | 0 | 0 | 0 |
| OK | VIEWCS1/svchost | 0 | 0 | 0 | 0 | 0 | 0 | 0 | 0 |
| OK | VIEWCS1/System | 0 | 0 | 2 | -56 | 0 | 0 | 0 | 0 |
| OK | VIEWCS1/taskeng | 0 | 0 | 0 | 0 | 0 | 0 | 0 | 0 |
| OK | VIEWCS1/taskhost | 0 | 0 | 0 | 0 | 0 | 0 | 0 | 0 |
| OK | VIEWCS1/ViewTopoSvc | 0 | 0 | 2 | 56 | 0 | 0 | 0 | 0 |
| OK | VIEWCS1/vmtoolsd#1 | 0 | 0 | 0 | 0 | 0 | 0 | 0 | 0 |
| OK | VIEWCS1/vmtoolsd | 0 | 0 | 0 | 0 | 0 | 0 | 0 | 0 |
| OK | VIEWCS1/VMwareTray | 0 | 0 | 0 | 0 | 0 | 0 | 0 | 0 |
| OK | VIEWCS1/vmware-usbarbitrator | 0 | 0 | 0 | 0 | 0 | 0 | 0 | 0 |
| OK | VIEWCS1/wininit | 0 | 0 | 0 | 0 | 0 | 0 | 0 | 0 |
| OK | VIEWCS1/winlogon#1 | 0 | 0 | 0 | 0 | 0 | 0 | 0 | 0 |
| OK | VIEWCS1/winlogon | 0 | 0 | 0 | 0 | 0 | 0 | 0 | 0 |
| OK | VIEWCS1/WmiApSrv | 0 | 0 | 0 | 0 | 0 | 0 | 0 | 0 |
| OK | VIEWCS1/WmiPrvSE#1 | 0 | 0 | 0 | 0 | 0 | 0 | 0 | 0 |
| OK | VIEWCS1/WmiPrvSE | 0 | 0 | 0 | 0 | 0 | 0 | 0 | 0 |
| OK | VIEWCS1/ws_ConnectionServer | 0 | 0 | 0 | 0 | 0 | 0 | 0 | 0 |
| OK | VIEWCS1/ws_MessageBusService | 4 | 4 | 5 | 28 | 0 | 4 | 4 | 4 |
| OK | VIEWCS1/ws_TomcatService | 0 | 7 | 18 | 338 | 6 | 6 | 5 | 3 |
| OK | VIEWCS1/ws_TunnelService | 0 | 1 | 1 | 0 | 0 | 1 | 1 | 1 |
| OK | VIEWCS1/wsnm | 0 | 0 | 1 | 0 | 0 | 0 | 0 | 0 |
Alerts
| An alert is generated if any of the thresholds were broken during one of the time ranges analyzed. The background of each of the values represents the highest priority threshold that the value broke. See each of the counter’s respective analysis section for more details about what the threshold means. |
| No Alerts Found |
|---|
Process IO Other Operations/sec
Description: The rate at which the process is issuing I/O operations that are neither read nor write operations (for example, a control function). This counter counts all I/O activity generated by the process to include file, network and device I/Os.


Overall Counter Instance Statistics
| Overall statistics of each of the counter instances. Min, Avg, and Max are the minimum, average, and Maximum values in the entire log. Hourly Trend is the calculated hourly slope of the entire log. 10%, 20%, and 30% of Outliers Removed is the average of the values after the percentage of outliers furthest away from the average have been removed. This is to help determine if a small percentage of the values are extreme which can skew the average. |
| Condition | Process(*)IO Other Operations/sec | Min | Avg | Max | Hourly Trend | Std Deviation | 10% of Outliers Removed | 20% of Outliers Removed | 30% of Outliers Removed |
|---|---|---|---|---|---|---|---|---|---|
| OK | VIEWCS1/avagent | 0 | 1 | 17 | -478 | 4 | 0 | 0 | 0 |
| OK | VIEWCS1/avscc | 0 | 0 | 0 | 0 | 0 | 0 | 0 | 0 |
| OK | VIEWCS1/csrss#1 | 0 | 0 | 0 | 0 | 0 | 0 | 0 | 0 |
| OK | VIEWCS1/csrss#2 | 0 | 0 | 0 | 0 | 0 | 0 | 0 | 0 |
| OK | VIEWCS1/csrss | 0 | 0 | 3 | -84 | 1 | 0 | 0 | 0 |
| OK | VIEWCS1/dllhost#1 | – | – | – | – | – | – | – | – |
| OK | VIEWCS1/dllhost | 0 | 0 | 0 | 0 | 0 | 0 | 0 | 0 |
| OK | VIEWCS1/dsamain | 0 | 2 | 11 | 56 | 3 | 1 | 1 | 1 |
| OK | VIEWCS1/dwm | 0 | 0 | 0 | 0 | 0 | 0 | 0 | 0 |
| OK | VIEWCS1/explorer | 0 | 1 | 1 | -28 | 0 | 1 | 1 | 1 |
| OK | VIEWCS1/FlashUtil32_11_4_402_278_ActiveX | 0 | 0 | 0 | 0 | 0 | 0 | 0 | 0 |
| OK | VIEWCS1/Idle | 0 | 0 | 0 | 0 | 0 | 0 | 0 | 0 |
| OK | VIEWCS1/iexplore#1 | 0 | 0 | 0 | 0 | 0 | 0 | 0 | 0 |
| OK | VIEWCS1/iexplore#2 | 0 | 7 | 10 | 0 | 4 | 6 | 6 | 6 |
| OK | VIEWCS1/iexplore#3 | 0 | 0 | 0 | 0 | 0 | 0 | 0 | 0 |
| OK | VIEWCS1/iexplore | 0 | 3 | 4 | 0 | 2 | 3 | 3 | 2 |
| OK | VIEWCS1/LogonUI | 0 | 0 | 0 | 0 | 0 | 0 | 0 | 0 |
| OK | VIEWCS1/lsass | 0 | 1 | 4 | 0 | 2 | 0 | 0 | 0 |
| OK | VIEWCS1/lsm | 0 | 0 | 0 | 0 | 0 | 0 | 0 | 0 |
| OK | VIEWCS1/Microsoft.ActiveDirectory.WebServices | 0 | 0 | 0 | 0 | 0 | 0 | 0 | 0 |
| OK | VIEWCS1/mmc#1 | 0 | 0 | 0 | 0 | 0 | 0 | 0 | 0 |
| OK | VIEWCS1/mmc#2 | 0 | 0 | 0 | 0 | 0 | 0 | 0 | 0 |
| OK | VIEWCS1/mmc | 0 | 0 | 0 | 0 | 0 | 0 | 0 | 0 |
| OK | VIEWCS1/msdtc | 0 | 0 | 0 | 0 | 0 | 0 | 0 | 0 |
| OK | VIEWCS1/rdpclip | 0 | 0 | 0 | 0 | 0 | 0 | 0 | 0 |
| OK | VIEWCS1/rundll32 | 2 | 2 | 2 | 0 | 0 | 2 | 2 | 2 |
| OK | VIEWCS1/SecurityGateway | 6 | 6 | 6 | 0 | 0 | 6 | 6 | 6 |
| OK | VIEWCS1/services | 0 | 0 | 0 | 0 | 0 | 0 | 0 | 0 |
| OK | VIEWCS1/smss | 0 | 0 | 0 | 0 | 0 | 0 | 0 | 0 |
| OK | VIEWCS1/spoolsv | 0 | 0 | 0 | 0 | 0 | 0 | 0 | 0 |
| OK | VIEWCS1/svchost#1 | 0 | 0 | 1 | 28 | 0 | 0 | 0 | 0 |
| OK | VIEWCS1/svchost#10 | 0 | 0 | 0 | 0 | 0 | 0 | 0 | 0 |
| OK | VIEWCS1/svchost#11 | 0 | 0 | 0 | 0 | 0 | 0 | 0 | 0 |
| OK | VIEWCS1/svchost#2 | 0 | 0 | 1 | 0 | 0 | 0 | 0 | 0 |
| OK | VIEWCS1/svchost#3 | 0 | 0 | 6 | 0 | 1 | 0 | 0 | 0 |
| OK | VIEWCS1/svchost#4 | 0 | 0 | 2 | 0 | 1 | 0 | 0 | 0 |
| OK | VIEWCS1/svchost#5 | 0 | 0 | 0 | 0 | 0 | 0 | 0 | 0 |
| OK | VIEWCS1/svchost#6 | 1 | 1 | 2 | 0 | 0 | 1 | 1 | 1 |
| OK | VIEWCS1/svchost#7 | 0 | 0 | 8 | 0 | 2 | 0 | 0 | 0 |
| OK | VIEWCS1/svchost#8 | 0 | 0 | 0 | 0 | 0 | 0 | 0 | 0 |
| OK | VIEWCS1/svchost#9 | 0 | 0 | 0 | 0 | 0 | 0 | 0 | 0 |
| OK | VIEWCS1/svchost | 0 | 0 | 5 | 0 | 1 | 0 | 0 | 0 |
| OK | VIEWCS1/System | 0 | 0 | 1 | -28 | 0 | 0 | 0 | 0 |
| OK | VIEWCS1/taskeng | 0 | 0 | 0 | 0 | 0 | 0 | 0 | 0 |
| OK | VIEWCS1/taskhost | 0 | 0 | 0 | 0 | 0 | 0 | 0 | 0 |
| OK | VIEWCS1/ViewTopoSvc | 0 | 0 | 5 | 56 | 1 | 0 | 0 | 0 |
| OK | VIEWCS1/vmtoolsd#1 | 3 | 3 | 3 | 0 | 0 | 3 | 3 | 3 |
| OK | VIEWCS1/vmtoolsd | 3 | 16 | 32 | 0 | 15 | 14 | 13 | 10 |
| OK | VIEWCS1/VMwareTray | 3 | 3 | 3 | 0 | 0 | 3 | 3 | 3 |
| OK | VIEWCS1/vmware-usbarbitrator | 1 | 1 | 1 | 0 | 0 | 1 | 1 | 1 |
| OK | VIEWCS1/wininit | 0 | 0 | 0 | 0 | 0 | 0 | 0 | 0 |
| OK | VIEWCS1/winlogon#1 | 0 | 0 | 0 | 0 | 0 | 0 | 0 | 0 |
| OK | VIEWCS1/winlogon | 0 | 0 | 0 | 0 | 0 | 0 | 0 | 0 |
| OK | VIEWCS1/WmiApSrv | 2 | 2 | 2 | 0 | 0 | 2 | 2 | 2 |
| OK | VIEWCS1/WmiPrvSE#1 | 0 | 0 | 0 | 0 | 0 | 0 | 0 | 0 |
| OK | VIEWCS1/WmiPrvSE | 0 | 0 | 0 | 0 | 0 | 0 | 0 | 0 |
| OK | VIEWCS1/ws_ConnectionServer | 0 | 0 | 0 | 0 | 0 | 0 | 0 | 0 |
| OK | VIEWCS1/ws_MessageBusService | 15 | 18 | 23 | 225 | 2 | 17 | 17 | 16 |
| OK | VIEWCS1/ws_TomcatService | 11 | 45 | 97 | 1,238 | 29 | 39 | 35 | 29 |
| OK | VIEWCS1/ws_TunnelService | 9 | 10 | 12 | 0 | 1 | 10 | 9 | 9 |
| OK | VIEWCS1/wsnm | 0 | 3 | 35 | 56 | 9 | 1 | 0 | 0 |
Alerts
| An alert is generated if any of the thresholds were broken during one of the time ranges analyzed. The background of each of the values represents the highest priority threshold that the value broke. See each of the counter’s respective analysis section for more details about what the threshold means. |
| No Alerts Found |
|---|
Process ID Process
Description: ID Process is the unique identifier of this process. ID Process numbers are reused, so they only identify a process for the lifetime of that process.


Overall Counter Instance Statistics
| Overall statistics of each of the counter instances. Min, Avg, and Max are the minimum, average, and Maximum values in the entire log. Hourly Trend is the calculated hourly slope of the entire log. 10%, 20%, and 30% of Outliers Removed is the average of the values after the percentage of outliers furthest away from the average have been removed. This is to help determine if a small percentage of the values are extreme which can skew the average. |
| Condition | Process(*)ID Process | Min | Avg | Max | Hourly Trend | Std Deviation | 10% of Outliers Removed | 20% of Outliers Removed | 30% of Outliers Removed |
|---|---|---|---|---|---|---|---|---|---|
| No Thresholds | VIEWCS1/_Total | 0 | 0 | 0 | 0 | 0 | 0 | 0 | 0 |
| No Thresholds | VIEWCS1/avagent | 1,260 | 1,260 | 1,260 | 0 | 0 | 1,260 | 1,260 | 1,260 |
| No Thresholds | VIEWCS1/avscc | 4,856 | 4,856 | 4,856 | 0 | 0 | 4,856 | 4,856 | 4,856 |
| No Thresholds | VIEWCS1/csrss#1 | 448 | 448 | 448 | 0 | 0 | 448 | 448 | 448 |
| No Thresholds | VIEWCS1/csrss#2 | 4,584 | 4,584 | 4,584 | 0 | 0 | 4,584 | 4,584 | 4,584 |
| No Thresholds | VIEWCS1/csrss | 344 | 344 | 344 | 0 | 0 | 344 | 344 | 344 |
| No Thresholds | VIEWCS1/dllhost#1 | 6,104 | 6,104 | 6,104 | 0 | 0 | 6,104 | 6,104 | 6,104 |
| No Thresholds | VIEWCS1/dllhost | 2,280 | 2,280 | 2,280 | 0 | 0 | 2,280 | 2,280 | 2,280 |
| No Thresholds | VIEWCS1/dsamain | 1,076 | 1,076 | 1,076 | 0 | 0 | 1,076 | 1,076 | 1,076 |
| No Thresholds | VIEWCS1/dwm | 4,920 | 4,920 | 4,920 | 0 | 0 | 4,920 | 4,920 | 4,920 |
| No Thresholds | VIEWCS1/explorer | 4,992 | 4,992 | 4,992 | 0 | 0 | 4,992 | 4,992 | 4,992 |
| No Thresholds | VIEWCS1/FlashUtil32_11_4_402_278_ActiveX | 3,364 | 3,364 | 3,364 | 0 | 0 | 3,364 | 3,364 | 3,364 |
| No Thresholds | VIEWCS1/Idle | 0 | 0 | 0 | 0 | 0 | 0 | 0 | 0 |
| No Thresholds | VIEWCS1/iexplore#1 | 5,416 | 5,416 | 5,416 | 0 | 0 | 5,416 | 5,416 | 5,416 |
| No Thresholds | VIEWCS1/iexplore#2 | 5,176 | 5,176 | 5,176 | 0 | 0 | 5,176 | 5,176 | 5,176 |
| No Thresholds | VIEWCS1/iexplore#3 | 5,060 | 5,060 | 5,060 | 0 | 0 | 5,060 | 5,060 | 5,060 |
| No Thresholds | VIEWCS1/iexplore | 5,284 | 5,284 | 5,284 | 0 | 0 | 5,284 | 5,284 | 5,284 |
| No Thresholds | VIEWCS1/LogonUI | 824 | 824 | 824 | 0 | 0 | 824 | 824 | 824 |
| No Thresholds | VIEWCS1/lsass | 556 | 556 | 556 | 0 | 0 | 556 | 556 | 556 |
| No Thresholds | VIEWCS1/lsm | 564 | 564 | 564 | 0 | 0 | 564 | 564 | 564 |
| No Thresholds | VIEWCS1/Microsoft.ActiveDirectory.WebServices | 1,108 | 1,108 | 1,108 | 0 | 0 | 1,108 | 1,108 | 1,108 |
| No Thresholds | VIEWCS1/mmc#1 | 6,128 | 6,128 | 6,128 | 0 | 0 | 6,128 | 6,128 | 6,128 |
| No Thresholds | VIEWCS1/mmc#2 | 6,044 | 6,044 | 6,044 | 0 | 0 | 6,044 | 6,044 | 6,044 |
| No Thresholds | VIEWCS1/mmc | 768 | 768 | 768 | 0 | 0 | 768 | 768 | 768 |
| No Thresholds | VIEWCS1/msdtc | 2,360 | 2,360 | 2,360 | 0 | 0 | 2,360 | 2,360 | 2,360 |
| No Thresholds | VIEWCS1/rdpclip | 4,860 | 4,860 | 4,860 | 0 | 0 | 4,860 | 4,860 | 4,860 |
| No Thresholds | VIEWCS1/rundll32 | 5,628 | 5,628 | 5,628 | 0 | 0 | 5,628 | 5,628 | 5,628 |
| No Thresholds | VIEWCS1/SecurityGateway | 3,048 | 3,048 | 3,048 | 0 | 0 | 3,048 | 3,048 | 3,048 |
| No Thresholds | VIEWCS1/services | 540 | 540 | 540 | 0 | 0 | 540 | 540 | 540 |
| No Thresholds | VIEWCS1/smss | 240 | 240 | 240 | 0 | 0 | 240 | 240 | 240 |
| No Thresholds | VIEWCS1/spoolsv | 1,036 | 1,036 | 1,036 | 0 | 0 | 1,036 | 1,036 | 1,036 |
| No Thresholds | VIEWCS1/svchost#1 | 740 | 740 | 740 | 0 | 0 | 740 | 740 | 740 |
| No Thresholds | VIEWCS1/svchost#10 | 2,084 | 2,084 | 2,084 | 0 | 0 | 2,084 | 2,084 | 2,084 |
| No Thresholds | VIEWCS1/svchost#11 | 5,880 | 5,880 | 5,880 | 0 | 0 | 5,880 | 5,880 | 5,880 |
| No Thresholds | VIEWCS1/svchost#2 | 832 | 832 | 832 | 0 | 0 | 832 | 832 | 832 |
| No Thresholds | VIEWCS1/svchost#3 | 880 | 880 | 880 | 0 | 0 | 880 | 880 | 880 |
| No Thresholds | VIEWCS1/svchost#4 | 936 | 936 | 936 | 0 | 0 | 936 | 936 | 936 |
| No Thresholds | VIEWCS1/svchost#5 | 972 | 972 | 972 | 0 | 0 | 972 | 972 | 972 |
| No Thresholds | VIEWCS1/svchost#6 | 1,016 | 1,016 | 1,016 | 0 | 0 | 1,016 | 1,016 | 1,016 |
| No Thresholds | VIEWCS1/svchost#7 | 400 | 400 | 400 | 0 | 0 | 400 | 400 | 400 |
| No Thresholds | VIEWCS1/svchost#8 | 1,316 | 1,316 | 1,316 | 0 | 0 | 1,316 | 1,316 | 1,316 |
| No Thresholds | VIEWCS1/svchost#9 | 1,148 | 1,148 | 1,148 | 0 | 0 | 1,148 | 1,148 | 1,148 |
| No Thresholds | VIEWCS1/svchost | 660 | 660 | 660 | 0 | 0 | 660 | 660 | 660 |
| No Thresholds | VIEWCS1/System | 4 | 4 | 4 | 0 | 0 | 4 | 4 | 4 |
| No Thresholds | VIEWCS1/taskeng | 5,712 | 5,712 | 5,712 | 0 | 0 | 5,712 | 5,712 | 5,712 |
| No Thresholds | VIEWCS1/taskhost | 4,776 | 4,776 | 4,776 | 0 | 0 | 4,776 | 4,776 | 4,776 |
| No Thresholds | VIEWCS1/ViewTopoSvc | 1,372 | 1,372 | 1,372 | 0 | 0 | 1,372 | 1,372 | 1,372 |
| No Thresholds | VIEWCS1/vmtoolsd#1 | 4,588 | 4,588 | 4,588 | 0 | 0 | 4,588 | 4,588 | 4,588 |
| No Thresholds | VIEWCS1/vmtoolsd | 1,720 | 1,720 | 1,720 | 0 | 0 | 1,720 | 1,720 | 1,720 |
| No Thresholds | VIEWCS1/VMwareTray | 3,652 | 3,652 | 3,652 | 0 | 0 | 3,652 | 3,652 | 3,652 |
| No Thresholds | VIEWCS1/vmware-usbarbitrator | 1,492 | 1,492 | 1,492 | 0 | 0 | 1,492 | 1,492 | 1,492 |
| No Thresholds | VIEWCS1/wininit | 440 | 440 | 440 | 0 | 0 | 440 | 440 | 440 |
| No Thresholds | VIEWCS1/winlogon#1 | 4,608 | 4,608 | 4,608 | 0 | 0 | 4,608 | 4,608 | 4,608 |
| No Thresholds | VIEWCS1/winlogon | 496 | 496 | 496 | 0 | 0 | 496 | 496 | 496 |
| No Thresholds | VIEWCS1/WmiApSrv | 4,880 | 4,880 | 4,880 | 0 | 0 | 4,880 | 4,880 | 4,880 |
| No Thresholds | VIEWCS1/WmiPrvSE#1 | 6,036 | 6,036 | 6,036 | 0 | 0 | 6,036 | 6,036 | 6,036 |
| No Thresholds | VIEWCS1/WmiPrvSE | 1,788 | 1,788 | 1,788 | 0 | 0 | 1,788 | 1,788 | 1,788 |
| No Thresholds | VIEWCS1/ws_ConnectionServer | 1,808 | 1,808 | 1,808 | 0 | 0 | 1,808 | 1,808 | 1,808 |
| No Thresholds | VIEWCS1/ws_MessageBusService | 2,852 | 2,852 | 2,852 | 0 | 0 | 2,852 | 2,852 | 2,852 |
| No Thresholds | VIEWCS1/ws_TomcatService | 3,056 | 3,056 | 3,056 | 0 | 0 | 3,056 | 3,056 | 3,056 |
| No Thresholds | VIEWCS1/ws_TunnelService | 3,040 | 3,040 | 3,040 | 0 | 0 | 3,040 | 3,040 | 3,040 |
| No Thresholds | VIEWCS1/wsnm | 1,332 | 1,332 | 1,332 | 0 | 0 | 1,332 | 1,332 | 1,332 |
Alerts
| An alert is generated if any of the thresholds were broken during one of the time ranges analyzed. The background of each of the values represents the highest priority threshold that the value broke. See each of the counter’s respective analysis section for more details about what the threshold means. |
| No Alerts Found |
|---|
Process IO Read Operations/sec
Description: The rate at which the process is issuing read I/O operations. This counter counts all I/O activity generated by the process to include file, network and device I/Os.


Overall Counter Instance Statistics
| Overall statistics of each of the counter instances. Min, Avg, and Max are the minimum, average, and Maximum values in the entire log. Hourly Trend is the calculated hourly slope of the entire log. 10%, 20%, and 30% of Outliers Removed is the average of the values after the percentage of outliers furthest away from the average have been removed. This is to help determine if a small percentage of the values are extreme which can skew the average. |
| Condition | Process(*)IO Read Operations/sec | Min | Avg | Max | Hourly Trend | Std Deviation | 10% of Outliers Removed | 20% of Outliers Removed | 30% of Outliers Removed |
|---|---|---|---|---|---|---|---|---|---|
| No Thresholds | VIEWCS1/avagent | 0 | 0 | 1 | -28 | 0 | 0 | 0 | 0 |
| No Thresholds | VIEWCS1/avscc | 0 | 0 | 0 | 0 | 0 | 0 | 0 | 0 |
| No Thresholds | VIEWCS1/csrss#1 | 0 | 0 | 0 | 0 | 0 | 0 | 0 | 0 |
| No Thresholds | VIEWCS1/csrss#2 | 0 | 0 | 1 | 0 | 0 | 0 | 0 | 0 |
| No Thresholds | VIEWCS1/csrss | 0 | 0 | 0 | 0 | 0 | 0 | 0 | 0 |
| No Thresholds | VIEWCS1/dllhost#1 | – | – | – | – | – | – | – | – |
| No Thresholds | VIEWCS1/dllhost | 0 | 0 | 0 | 0 | 0 | 0 | 0 | 0 |
| No Thresholds | VIEWCS1/dsamain | 0 | 0 | 0 | 0 | 0 | 0 | 0 | 0 |
| No Thresholds | VIEWCS1/dwm | 0 | 0 | 0 | 0 | 0 | 0 | 0 | 0 |
| No Thresholds | VIEWCS1/explorer | 0 | 1 | 1 | 0 | 1 | 1 | 1 | 1 |
| No Thresholds | VIEWCS1/FlashUtil32_11_4_402_278_ActiveX | 0 | 0 | 0 | 0 | 0 | 0 | 0 | 0 |
| No Thresholds | VIEWCS1/Idle | 0 | 0 | 0 | 0 | 0 | 0 | 0 | 0 |
| No Thresholds | VIEWCS1/iexplore#1 | 0 | 0 | 0 | 0 | 0 | 0 | 0 | 0 |
| No Thresholds | VIEWCS1/iexplore#2 | 0 | 0 | 0 | 0 | 0 | 0 | 0 | 0 |
| No Thresholds | VIEWCS1/iexplore#3 | 0 | 0 | 0 | 0 | 0 | 0 | 0 | 0 |
| No Thresholds | VIEWCS1/iexplore | 0 | 1 | 2 | 0 | 1 | 1 | 1 | 1 |
| No Thresholds | VIEWCS1/LogonUI | 0 | 0 | 0 | 0 | 0 | 0 | 0 | 0 |
| No Thresholds | VIEWCS1/lsass | 0 | 0 | 1 | 0 | 0 | 0 | 0 | 0 |
| No Thresholds | VIEWCS1/lsm | 0 | 0 | 0 | 0 | 0 | 0 | 0 | 0 |
| No Thresholds | VIEWCS1/Microsoft.ActiveDirectory.WebServices | 0 | 0 | 0 | 0 | 0 | 0 | 0 | 0 |
| No Thresholds | VIEWCS1/mmc#1 | 0 | 0 | 0 | 0 | 0 | 0 | 0 | 0 |
| No Thresholds | VIEWCS1/mmc#2 | 0 | 0 | 0 | 0 | 0 | 0 | 0 | 0 |
| No Thresholds | VIEWCS1/mmc | 0 | 0 | 0 | 0 | 0 | 0 | 0 | 0 |
| No Thresholds | VIEWCS1/msdtc | 0 | 0 | 0 | 0 | 0 | 0 | 0 | 0 |
| No Thresholds | VIEWCS1/rdpclip | 0 | 0 | 0 | 0 | 0 | 0 | 0 | 0 |
| No Thresholds | VIEWCS1/rundll32 | 0 | 0 | 0 | 0 | 0 | 0 | 0 | 0 |
| No Thresholds | VIEWCS1/SecurityGateway | 0 | 0 | 0 | 0 | 0 | 0 | 0 | 0 |
| No Thresholds | VIEWCS1/services | 0 | 0 | 0 | 0 | 0 | 0 | 0 | 0 |
| No Thresholds | VIEWCS1/smss | 0 | 0 | 0 | 0 | 0 | 0 | 0 | 0 |
| No Thresholds | VIEWCS1/spoolsv | 0 | 0 | 0 | 0 | 0 | 0 | 0 | 0 |
| No Thresholds | VIEWCS1/svchost#1 | 0 | 0 | 0 | 0 | 0 | 0 | 0 | 0 |
| No Thresholds | VIEWCS1/svchost#10 | 0 | 0 | 0 | 0 | 0 | 0 | 0 | 0 |
| No Thresholds | VIEWCS1/svchost#11 | 0 | 0 | 0 | 0 | 0 | 0 | 0 | 0 |
| No Thresholds | VIEWCS1/svchost#2 | 0 | 0 | 0 | 0 | 0 | 0 | 0 | 0 |
| No Thresholds | VIEWCS1/svchost#3 | 0 | 0 | 0 | 0 | 0 | 0 | 0 | 0 |
| No Thresholds | VIEWCS1/svchost#4 | 0 | 0 | 0 | 0 | 0 | 0 | 0 | 0 |
| No Thresholds | VIEWCS1/svchost#5 | 0 | 0 | 0 | 0 | 0 | 0 | 0 | 0 |
| No Thresholds | VIEWCS1/svchost#6 | 0 | 0 | 0 | 0 | 0 | 0 | 0 | 0 |
| No Thresholds | VIEWCS1/svchost#7 | 0 | 0 | 0 | 0 | 0 | 0 | 0 | 0 |
| No Thresholds | VIEWCS1/svchost#8 | 0 | 0 | 0 | 0 | 0 | 0 | 0 | 0 |
| No Thresholds | VIEWCS1/svchost#9 | 0 | 0 | 0 | 0 | 0 | 0 | 0 | 0 |
| No Thresholds | VIEWCS1/svchost | 0 | 0 | 0 | 0 | 0 | 0 | 0 | 0 |
| No Thresholds | VIEWCS1/System | 0 | 0 | 0 | 0 | 0 | 0 | 0 | 0 |
| No Thresholds | VIEWCS1/taskeng | 0 | 0 | 0 | 0 | 0 | 0 | 0 | 0 |
| No Thresholds | VIEWCS1/taskhost | 0 | 0 | 0 | 0 | 0 | 0 | 0 | 0 |
| No Thresholds | VIEWCS1/ViewTopoSvc | 0 | 0 | 0 | 0 | 0 | 0 | 0 | 0 |
| No Thresholds | VIEWCS1/vmtoolsd#1 | 0 | 0 | 0 | 0 | 0 | 0 | 0 | 0 |
| No Thresholds | VIEWCS1/vmtoolsd | 0 | 0 | 0 | 0 | 0 | 0 | 0 | 0 |
| No Thresholds | VIEWCS1/VMwareTray | 0 | 0 | 0 | 0 | 0 | 0 | 0 | 0 |
| No Thresholds | VIEWCS1/vmware-usbarbitrator | 0 | 0 | 0 | 0 | 0 | 0 | 0 | 0 |
| No Thresholds | VIEWCS1/wininit | 0 | 0 | 0 | 0 | 0 | 0 | 0 | 0 |
| No Thresholds | VIEWCS1/winlogon#1 | 0 | 0 | 0 | 0 | 0 | 0 | 0 | 0 |
| No Thresholds | VIEWCS1/winlogon | 0 | 0 | 0 | 0 | 0 | 0 | 0 | 0 |
| No Thresholds | VIEWCS1/WmiApSrv | 0 | 0 | 0 | 0 | 0 | 0 | 0 | 0 |
| No Thresholds | VIEWCS1/WmiPrvSE#1 | 0 | 0 | 0 | 0 | 0 | 0 | 0 | 0 |
| No Thresholds | VIEWCS1/WmiPrvSE | 0 | 0 | 0 | 0 | 0 | 0 | 0 | 0 |
| No Thresholds | VIEWCS1/ws_ConnectionServer | 0 | 0 | 0 | 0 | 0 | 0 | 0 | 0 |
| No Thresholds | VIEWCS1/ws_MessageBusService | 0 | 0 | 0 | 0 | 0 | 0 | 0 | 0 |
| No Thresholds | VIEWCS1/ws_TomcatService | 0 | 0 | 1 | 0 | 0 | 0 | 0 | 0 |
| No Thresholds | VIEWCS1/ws_TunnelService | 0 | 0 | 0 | 0 | 0 | 0 | 0 | 0 |
| No Thresholds | VIEWCS1/wsnm | 0 | 0 | 0 | 0 | 0 | 0 | 0 | 0 |
Alerts
| An alert is generated if any of the thresholds were broken during one of the time ranges analyzed. The background of each of the values represents the highest priority threshold that the value broke. See each of the counter’s respective analysis section for more details about what the threshold means. |
| No Alerts Found |
|---|
Process IO Write Operations/sec
Description: The rate at which the process is issuing write I/O operations. This counter counts all I/O activity generated by the process to include file, network and device I/Os.


Overall Counter Instance Statistics
| Overall statistics of each of the counter instances. Min, Avg, and Max are the minimum, average, and Maximum values in the entire log. Hourly Trend is the calculated hourly slope of the entire log. 10%, 20%, and 30% of Outliers Removed is the average of the values after the percentage of outliers furthest away from the average have been removed. This is to help determine if a small percentage of the values are extreme which can skew the average. |
| Condition | Process(*)IO Write Operations/sec | Min | Avg | Max | Hourly Trend | Std Deviation | 10% of Outliers Removed | 20% of Outliers Removed | 30% of Outliers Removed |
|---|---|---|---|---|---|---|---|---|---|
| No Thresholds | VIEWCS1/avagent | 0 | 0 | 2 | -56 | 0 | 0 | 0 | 0 |
| No Thresholds | VIEWCS1/avscc | 0 | 0 | 0 | 0 | 0 | 0 | 0 | 0 |
| No Thresholds | VIEWCS1/csrss#1 | 0 | 0 | 0 | 0 | 0 | 0 | 0 | 0 |
| No Thresholds | VIEWCS1/csrss#2 | 0 | 0 | 0 | 0 | 0 | 0 | 0 | 0 |
| No Thresholds | VIEWCS1/csrss | 0 | 0 | 0 | 0 | 0 | 0 | 0 | 0 |
| No Thresholds | VIEWCS1/dllhost#1 | – | – | – | – | – | – | – | – |
| No Thresholds | VIEWCS1/dllhost | 0 | 0 | 0 | 0 | 0 | 0 | 0 | 0 |
| No Thresholds | VIEWCS1/dsamain | 0 | 0 | 2 | 0 | 1 | 0 | 0 | 0 |
| No Thresholds | VIEWCS1/dwm | 0 | 0 | 0 | 0 | 0 | 0 | 0 | 0 |
| No Thresholds | VIEWCS1/explorer | 0 | 0 | 0 | 0 | 0 | 0 | 0 | 0 |
| No Thresholds | VIEWCS1/FlashUtil32_11_4_402_278_ActiveX | 0 | 0 | 0 | 0 | 0 | 0 | 0 | 0 |
| No Thresholds | VIEWCS1/Idle | 0 | 0 | 0 | 0 | 0 | 0 | 0 | 0 |
| No Thresholds | VIEWCS1/iexplore#1 | 0 | 0 | 0 | 0 | 0 | 0 | 0 | 0 |
| No Thresholds | VIEWCS1/iexplore#2 | 0 | 0 | 0 | 0 | 0 | 0 | 0 | 0 |
| No Thresholds | VIEWCS1/iexplore#3 | 0 | 0 | 0 | 0 | 0 | 0 | 0 | 0 |
| No Thresholds | VIEWCS1/iexplore | 0 | 1 | 1 | 0 | 0 | 1 | 1 | 1 |
| No Thresholds | VIEWCS1/LogonUI | 0 | 0 | 0 | 0 | 0 | 0 | 0 | 0 |
| No Thresholds | VIEWCS1/lsass | 0 | 0 | 1 | 0 | 0 | 0 | 0 | 0 |
| No Thresholds | VIEWCS1/lsm | 0 | 0 | 0 | 0 | 0 | 0 | 0 | 0 |
| No Thresholds | VIEWCS1/Microsoft.ActiveDirectory.WebServices | 0 | 0 | 0 | 0 | 0 | 0 | 0 | 0 |
| No Thresholds | VIEWCS1/mmc#1 | 0 | 0 | 0 | 0 | 0 | 0 | 0 | 0 |
| No Thresholds | VIEWCS1/mmc#2 | 0 | 0 | 0 | 0 | 0 | 0 | 0 | 0 |
| No Thresholds | VIEWCS1/mmc | 0 | 0 | 0 | 0 | 0 | 0 | 0 | 0 |
| No Thresholds | VIEWCS1/msdtc | 0 | 0 | 0 | 0 | 0 | 0 | 0 | 0 |
| No Thresholds | VIEWCS1/rdpclip | 0 | 0 | 0 | 0 | 0 | 0 | 0 | 0 |
| No Thresholds | VIEWCS1/rundll32 | 0 | 0 | 0 | 0 | 0 | 0 | 0 | 0 |
| No Thresholds | VIEWCS1/SecurityGateway | 1 | 1 | 2 | 0 | 0 | 1 | 1 | 1 |
| No Thresholds | VIEWCS1/services | 0 | 0 | 0 | 0 | 0 | 0 | 0 | 0 |
| No Thresholds | VIEWCS1/smss | 0 | 0 | 0 | 0 | 0 | 0 | 0 | 0 |
| No Thresholds | VIEWCS1/spoolsv | 0 | 0 | 0 | 0 | 0 | 0 | 0 | 0 |
| No Thresholds | VIEWCS1/svchost#1 | 0 | 0 | 0 | 0 | 0 | 0 | 0 | 0 |
| No Thresholds | VIEWCS1/svchost#10 | 0 | 0 | 0 | 0 | 0 | 0 | 0 | 0 |
| No Thresholds | VIEWCS1/svchost#11 | 0 | 0 | 0 | 0 | 0 | 0 | 0 | 0 |
| No Thresholds | VIEWCS1/svchost#2 | 0 | 0 | 1 | 0 | 0 | 0 | 0 | 0 |
| No Thresholds | VIEWCS1/svchost#3 | 0 | 0 | 1 | 0 | 0 | 0 | 0 | 0 |
| No Thresholds | VIEWCS1/svchost#4 | 0 | 0 | 0 | 0 | 0 | 0 | 0 | 0 |
| No Thresholds | VIEWCS1/svchost#5 | 0 | 0 | 0 | 0 | 0 | 0 | 0 | 0 |
| No Thresholds | VIEWCS1/svchost#6 | 0 | 0 | 0 | 0 | 0 | 0 | 0 | 0 |
| No Thresholds | VIEWCS1/svchost#7 | 0 | 0 | 0 | 0 | 0 | 0 | 0 | 0 |
| No Thresholds | VIEWCS1/svchost#8 | 0 | 0 | 0 | 0 | 0 | 0 | 0 | 0 |
| No Thresholds | VIEWCS1/svchost#9 | 0 | 0 | 0 | 0 | 0 | 0 | 0 | 0 |
| No Thresholds | VIEWCS1/svchost | 0 | 0 | 0 | 0 | 0 | 0 | 0 | 0 |
| No Thresholds | VIEWCS1/System | 0 | 0 | 2 | -56 | 0 | 0 | 0 | 0 |
| No Thresholds | VIEWCS1/taskeng | 0 | 0 | 0 | 0 | 0 | 0 | 0 | 0 |
| No Thresholds | VIEWCS1/taskhost | 0 | 0 | 0 | 0 | 0 | 0 | 0 | 0 |
| No Thresholds | VIEWCS1/ViewTopoSvc | 0 | 0 | 2 | 56 | 0 | 0 | 0 | 0 |
| No Thresholds | VIEWCS1/vmtoolsd#1 | 0 | 0 | 0 | 0 | 0 | 0 | 0 | 0 |
| No Thresholds | VIEWCS1/vmtoolsd | 0 | 0 | 0 | 0 | 0 | 0 | 0 | 0 |
| No Thresholds | VIEWCS1/VMwareTray | 0 | 0 | 0 | 0 | 0 | 0 | 0 | 0 |
| No Thresholds | VIEWCS1/vmware-usbarbitrator | 0 | 0 | 0 | 0 | 0 | 0 | 0 | 0 |
| No Thresholds | VIEWCS1/wininit | 0 | 0 | 0 | 0 | 0 | 0 | 0 | 0 |
| No Thresholds | VIEWCS1/winlogon#1 | 0 | 0 | 0 | 0 | 0 | 0 | 0 | 0 |
| No Thresholds | VIEWCS1/winlogon | 0 | 0 | 0 | 0 | 0 | 0 | 0 | 0 |
| No Thresholds | VIEWCS1/WmiApSrv | 0 | 0 | 0 | 0 | 0 | 0 | 0 | 0 |
| No Thresholds | VIEWCS1/WmiPrvSE#1 | 0 | 0 | 0 | 0 | 0 | 0 | 0 | 0 |
| No Thresholds | VIEWCS1/WmiPrvSE | 0 | 0 | 0 | 0 | 0 | 0 | 0 | 0 |
| No Thresholds | VIEWCS1/ws_ConnectionServer | 0 | 0 | 0 | 0 | 0 | 0 | 0 | 0 |
| No Thresholds | VIEWCS1/ws_MessageBusService | 4 | 4 | 5 | 28 | 0 | 4 | 4 | 4 |
| No Thresholds | VIEWCS1/ws_TomcatService | 0 | 7 | 18 | 338 | 6 | 5 | 5 | 3 |
| No Thresholds | VIEWCS1/ws_TunnelService | 0 | 1 | 1 | 0 | 0 | 1 | 1 | 1 |
| No Thresholds | VIEWCS1/wsnm | 0 | 0 | 1 | 0 | 0 | 0 | 0 | 0 |
Alerts
| An alert is generated if any of the thresholds were broken during one of the time ranges analyzed. The background of each of the values represents the highest priority threshold that the value broke. See each of the counter’s respective analysis section for more details about what the threshold means. |
| No Alerts Found |
|---|
Process % Privileged Time
Description: % Privileged Time is the percentage of elapsed time that the process threads spent executing code in privileged mode. When a Windows system service is called, the service will often run in privileged mode to gain access to system-private data. Such data is protected from access by threads executing in user mode. Calls to the system can be explicit or implicit, such as page faults or interrupts. Unlike some early operating systems, Windows uses process boundaries for subsystem protection in addition to the traditional protection of user and privileged modes. Some work done by Windows on behalf of the application might appear in other subsystem processes in addition to the privileged time in the process.


Overall Counter Instance Statistics
| Overall statistics of each of the counter instances. Min, Avg, and Max are the minimum, average, and Maximum values in the entire log. Hourly Trend is the calculated hourly slope of the entire log. 10%, 20%, and 30% of Outliers Removed is the average of the values after the percentage of outliers furthest away from the average have been removed. This is to help determine if a small percentage of the values are extreme which can skew the average. |
| Condition | Process(*)% Privileged Time | Min | Avg | Max | Hourly Trend | Std Deviation | 10% of Outliers Removed | 20% of Outliers Removed | 30% of Outliers Removed |
|---|---|---|---|---|---|---|---|---|---|
| No Thresholds | VIEWCS1/avagent | 0 | 0 | 0 | 0 | 0 | 0 | 0 | 0 |
| No Thresholds | VIEWCS1/avscc | 0 | 0 | 0 | 0 | 0 | 0 | 0 | 0 |
| No Thresholds | VIEWCS1/csrss#1 | 0 | 0 | 0 | 0 | 0 | 0 | 0 | 0 |
| No Thresholds | VIEWCS1/csrss#2 | 0 | 0 | 0 | 0 | 0 | 0 | 0 | 0 |
| No Thresholds | VIEWCS1/csrss | 0 | 0 | 0 | 0 | 0 | 0 | 0 | 0 |
| No Thresholds | VIEWCS1/dllhost#1 | – | – | – | – | – | – | – | – |
| No Thresholds | VIEWCS1/dllhost | 0 | 0 | 0 | 0 | 0 | 0 | 0 | 0 |
| No Thresholds | VIEWCS1/dsamain | 0 | 0 | 0 | 0 | 0 | 0 | 0 | 0 |
| No Thresholds | VIEWCS1/dwm | 0 | 0 | 0 | 0 | 0 | 0 | 0 | 0 |
| No Thresholds | VIEWCS1/explorer | 0 | 0 | 0 | 0 | 0 | 0 | 0 | 0 |
| No Thresholds | VIEWCS1/FlashUtil32_11_4_402_278_ActiveX | 0 | 0 | 0 | 0 | 0 | 0 | 0 | 0 |
| No Thresholds | VIEWCS1/iexplore#1 | 0 | 0 | 0 | 0 | 0 | 0 | 0 | 0 |
| No Thresholds | VIEWCS1/iexplore#2 | 0 | 0 | 0 | 0 | 0 | 0 | 0 | 0 |
| No Thresholds | VIEWCS1/iexplore#3 | 0 | 0 | 0 | 0 | 0 | 0 | 0 | 0 |
| No Thresholds | VIEWCS1/iexplore | 0 | 0 | 0 | 0 | 0 | 0 | 0 | 0 |
| No Thresholds | VIEWCS1/LogonUI | 0 | 0 | 0 | 0 | 0 | 0 | 0 | 0 |
| No Thresholds | VIEWCS1/lsass | 0 | 0 | 0 | 0 | 0 | 0 | 0 | 0 |
| No Thresholds | VIEWCS1/lsm | 0 | 0 | 0 | 0 | 0 | 0 | 0 | 0 |
| No Thresholds | VIEWCS1/Microsoft.ActiveDirectory.WebServices | 0 | 0 | 0 | 0 | 0 | 0 | 0 | 0 |
| No Thresholds | VIEWCS1/mmc#1 | 0 | 0 | 0 | 0 | 0 | 0 | 0 | 0 |
| No Thresholds | VIEWCS1/mmc#2 | 0 | 0 | 2 | 56 | 1 | 0 | 0 | 0 |
| No Thresholds | VIEWCS1/mmc | 0 | 0 | 0 | 0 | 0 | 0 | 0 | 0 |
| No Thresholds | VIEWCS1/msdtc | 0 | 0 | 0 | 0 | 0 | 0 | 0 | 0 |
| No Thresholds | VIEWCS1/rdpclip | 0 | 0 | 0 | 0 | 0 | 0 | 0 | 0 |
| No Thresholds | VIEWCS1/rundll32 | 0 | 0 | 0 | 0 | 0 | 0 | 0 | 0 |
| No Thresholds | VIEWCS1/SecurityGateway | 0 | 0 | 0 | 0 | 0 | 0 | 0 | 0 |
| No Thresholds | VIEWCS1/services | 0 | 0 | 0 | 0 | 0 | 0 | 0 | 0 |
| No Thresholds | VIEWCS1/smss | 0 | 0 | 0 | 0 | 0 | 0 | 0 | 0 |
| No Thresholds | VIEWCS1/spoolsv | 0 | 0 | 0 | 0 | 0 | 0 | 0 | 0 |
| No Thresholds | VIEWCS1/svchost#1 | 0 | 0 | 0 | 0 | 0 | 0 | 0 | 0 |
| No Thresholds | VIEWCS1/svchost#10 | 0 | 0 | 0 | 0 | 0 | 0 | 0 | 0 |
| No Thresholds | VIEWCS1/svchost#11 | 0 | 0 | 0 | 0 | 0 | 0 | 0 | 0 |
| No Thresholds | VIEWCS1/svchost#2 | 0 | 0 | 0 | 0 | 0 | 0 | 0 | 0 |
| No Thresholds | VIEWCS1/svchost#3 | 0 | 0 | 0 | 0 | 0 | 0 | 0 | 0 |
| No Thresholds | VIEWCS1/svchost#4 | 0 | 0 | 0 | 0 | 0 | 0 | 0 | 0 |
| No Thresholds | VIEWCS1/svchost#5 | 0 | 0 | 0 | 0 | 0 | 0 | 0 | 0 |
| No Thresholds | VIEWCS1/svchost#6 | 0 | 0 | 0 | 0 | 0 | 0 | 0 | 0 |
| No Thresholds | VIEWCS1/svchost#7 | 0 | 0 | 0 | 0 | 0 | 0 | 0 | 0 |
| No Thresholds | VIEWCS1/svchost#8 | 0 | 0 | 0 | 0 | 0 | 0 | 0 | 0 |
| No Thresholds | VIEWCS1/svchost#9 | 0 | 0 | 0 | 0 | 0 | 0 | 0 | 0 |
| No Thresholds | VIEWCS1/svchost | 0 | 0 | 0 | 0 | 0 | 0 | 0 | 0 |
| No Thresholds | VIEWCS1/System | 0 | 0 | 0 | 0 | 0 | 0 | 0 | 0 |
| No Thresholds | VIEWCS1/taskeng | 0 | 0 | 0 | 0 | 0 | 0 | 0 | 0 |
| No Thresholds | VIEWCS1/taskhost | 0 | 0 | 0 | 0 | 0 | 0 | 0 | 0 |
| No Thresholds | VIEWCS1/ViewTopoSvc | 0 | 0 | 0 | 0 | 0 | 0 | 0 | 0 |
| No Thresholds | VIEWCS1/vmtoolsd#1 | 0 | 0 | 0 | 0 | 0 | 0 | 0 | 0 |
| No Thresholds | VIEWCS1/vmtoolsd | 0 | 0 | 0 | 0 | 0 | 0 | 0 | 0 |
| No Thresholds | VIEWCS1/VMwareTray | 0 | 0 | 0 | 0 | 0 | 0 | 0 | 0 |
| No Thresholds | VIEWCS1/vmware-usbarbitrator | 0 | 0 | 0 | 0 | 0 | 0 | 0 | 0 |
| No Thresholds | VIEWCS1/wininit | 0 | 0 | 0 | 0 | 0 | 0 | 0 | 0 |
| No Thresholds | VIEWCS1/winlogon#1 | 0 | 0 | 0 | 0 | 0 | 0 | 0 | 0 |
| No Thresholds | VIEWCS1/winlogon | 0 | 0 | 0 | 0 | 0 | 0 | 0 | 0 |
| No Thresholds | VIEWCS1/WmiApSrv | 0 | 0 | 0 | 0 | 0 | 0 | 0 | 0 |
| No Thresholds | VIEWCS1/WmiPrvSE#1 | 0 | 0 | 0 | 0 | 0 | 0 | 0 | 0 |
| No Thresholds | VIEWCS1/WmiPrvSE | 0 | 0 | 0 | 0 | 0 | 0 | 0 | 0 |
| No Thresholds | VIEWCS1/ws_ConnectionServer | 0 | 0 | 0 | 0 | 0 | 0 | 0 | 0 |
| No Thresholds | VIEWCS1/ws_MessageBusService | 0 | 0 | 0 | 0 | 0 | 0 | 0 | 0 |
| No Thresholds | VIEWCS1/ws_TomcatService | 0 | 0 | 1 | 0 | 0 | 0 | 0 | 0 |
| No Thresholds | VIEWCS1/ws_TunnelService | 0 | 0 | 0 | 0 | 0 | 0 | 0 | 0 |
| No Thresholds | VIEWCS1/wsnm | 0 | 0 | 0 | 0 | 0 | 0 | 0 | 0 |
Alerts
| An alert is generated if any of the thresholds were broken during one of the time ranges analyzed. The background of each of the values represents the highest priority threshold that the value broke. See each of the counter’s respective analysis section for more details about what the threshold means. |
| No Alerts Found |
|---|
Processor |
Processor % Processor Time
Description: % Processor Time is the percentage of elapsed time that the processor spends to execute a non-Idle thread. It is calculated by measuring the duration of the idle thread is active in the sample interval, and subtracting that time from interval duration. This counter is the primary indicator of processor activity, and displays the average percentage of busy time observed during the sample interval. % Processor Time is the sum of % User Time and % Privileged Time unless there is hardware involvement in the form of interupts and/or DPCs.
This analysis creates a Warning alert for utilization greater than 50% on any processor and creates a critical alert for utilization greater than 80%.
If average processor utilization is high based on the thresholds witin this analysis, then check if it is high user mode CPU or high privileged mode. If high privileged mode CPU is suspected, then see the Privileged Mode CPU Analysis. If a user-mode processor bottleneck is suspected, then consider using a process profiler to analyze the functions causing the high CPU consumption. See How To: Identify Functions causing a High User-mode CPU Bottleneck for Server Applications in a Production Environment article in the references section for more information.
References:


Overall Counter Instance Statistics
| Overall statistics of each of the counter instances. Min, Avg, and Max are the minimum, average, and Maximum values in the entire log. Hourly Trend is the calculated hourly slope of the entire log. 10%, 20%, and 30% of Outliers Removed is the average of the values after the percentage of outliers furthest away from the average have been removed. This is to help determine if a small percentage of the values are extreme which can skew the average. |
| Condition | Processor(*)% Processor Time | Min | Avg | Max | Hourly Trend | Std Deviation | 10% of Outliers Removed | 20% of Outliers Removed | 30% of Outliers Removed |
|---|---|---|---|---|---|---|---|---|---|
| OK | VIEWCS1/_Total | 1 | 2 | 6 | 0 | 1 | 1 | 1 | 1 |
| OK | VIEWCS1/0 | 1 | 2 | 6 | -28 | 1 | 2 | 2 | 1 |
| OK | VIEWCS1/1 | 0 | 1 | 5 | 28 | 1 | 1 | 0 | 0 |
Alerts
| An alert is generated if any of the thresholds were broken during one of the time ranges analyzed. The background of each of the values represents the highest priority threshold that the value broke. See each of the counter’s respective analysis section for more details about what the threshold means. |
| No Alerts Found |
|---|
Processor % Privileged Time
Description: This counter indicates the percentage of time a thread runs in privileged mode also known as kernel mode. When your application calls operating system functions (for example to perform file or network I/O or to allocate memory), these operating system functions are executed in privileged mode.
High privileged mode CPU indicates that computer is spending too much time in system I/O versus real (user mode) work. % Privileged Time is the percentage of elapsed time that the process threads spent executing code in privileged mode. When a Windows system service in called, the service will often run in privileged mode to gain access to system-private data. Such data is protected from access by threads executing in user mode. Calls to the system can be explicit or implicit, such as page faults or interrupts. Unlike some early operating systems, Windows uses process boundaries for subsystem protection in addition to the traditional protection of user and privileged modes. Some work done by Windows on behalf of the application might appear in other subsystem processes in addition to the privileged time in the process.
This analysis throws a warning alert if privileged mode CPU is consuming more than 20% of total CPU and a critical alert if consuming More than 30% of total CPU.
Next steps
The CPU consumption might be caused by another busy resource such as network, memory, or disk I/O. High privileged mode CPU can also by caused by high amounts of Context Switches/second. See the High Context Switches/second analysis. The KernRate (KrView) tool can be used to profile the kernel to see what component is consuming the most kernel resources. To see more information about how KernRate can be used to analyze high priviledge mode CPU problems, see Mark Russinovich’s blog entry in the references section below.
References:


Overall Counter Instance Statistics
| Overall statistics of each of the counter instances. Min, Avg, and Max are the minimum, average, and Maximum values in the entire log. Hourly Trend is the calculated hourly slope of the entire log. 10%, 20%, and 30% of Outliers Removed is the average of the values after the percentage of outliers furthest away from the average have been removed. This is to help determine if a small percentage of the values are extreme which can skew the average. |
| Condition | Processor(*)% Privileged Time | Min | Avg | Max | Hourly Trend | Std Deviation | 10% of Outliers Removed | 20% of Outliers Removed | 30% of Outliers Removed |
|---|---|---|---|---|---|---|---|---|---|
| OK | VIEWCS1/_Total | 0 | 0 | 1 | 0 | 0 | 0 | 0 | 0 |
| OK | VIEWCS1/0 | 0 | 1 | 2 | 0 | 1 | 0 | 0 | 0 |
| OK | VIEWCS1/1 | 0 | 0 | 1 | 28 | 0 | 0 | 0 | 0 |
Alerts
| An alert is generated if any of the thresholds were broken during one of the time ranges analyzed. The background of each of the values represents the highest priority threshold that the value broke. See each of the counter’s respective analysis section for more details about what the threshold means. |
| No Alerts Found |
|---|
Processor % Interrupt Time
Description: % Interrupt Time is the time the processor spends receiving and servicing hardware interrupts during sample intervals. This value is an indirect indicator of the activity of devices that generate interrupts, such as the system clock, the mouse, disk drivers, data communication lines, network interface cards and other peripheral devices. These devices normally interrupt the processor when they have completed a task or require attention. Normal thread execution is suspended during interrupts. Most system clocks interrupt the processor every 10 milliseconds, creating a background of interrupt activity. A dramatic increase in this counter indicates potential hardware problems.
This analysis checks for % Interrupt Time greater than 30%. If this occurs, then consider updating devices drivers for hardware that correlates to this alert.
References:
Measuring .NET Application Performance


Overall Counter Instance Statistics
| Overall statistics of each of the counter instances. Min, Avg, and Max are the minimum, average, and Maximum values in the entire log. Hourly Trend is the calculated hourly slope of the entire log. 10%, 20%, and 30% of Outliers Removed is the average of the values after the percentage of outliers furthest away from the average have been removed. This is to help determine if a small percentage of the values are extreme which can skew the average. |
| Condition | Processor(*)% Interrupt Time | Min | Avg | Max | Hourly Trend | Std Deviation | 10% of Outliers Removed | 20% of Outliers Removed | 30% of Outliers Removed |
|---|---|---|---|---|---|---|---|---|---|
| OK | VIEWCS1/_Total | 0 | 0 | 0 | 0 | 0 | 0 | 0 | 0 |
| OK | VIEWCS1/0 | 0 | 0 | 0 | 0 | 0 | 0 | 0 | 0 |
| OK | VIEWCS1/1 | 0 | 0 | 0 | 0 | 0 | 0 | 0 | 0 |
Alerts
| An alert is generated if any of the thresholds were broken during one of the time ranges analyzed. The background of each of the values represents the highest priority threshold that the value broke. See each of the counter’s respective analysis section for more details about what the threshold means. |
| No Alerts Found |
|---|
Processor % DPC Time
Description: % DPC Time is the percentage of time that the processor spent receiving and servicing deferred procedure calls (DPCs) during the sample interval. DPCs are interrupts that run at a lower priority than standard interrupts. % DPC Time is a component of % Privileged Time because DPCs are executed in privileged mode. They are counted separately and are not a component of the interrupt counters. This counter displays the average busy time as a percentage of the sample time.


Overall Counter Instance Statistics
| Overall statistics of each of the counter instances. Min, Avg, and Max are the minimum, average, and Maximum values in the entire log. Hourly Trend is the calculated hourly slope of the entire log. 10%, 20%, and 30% of Outliers Removed is the average of the values after the percentage of outliers furthest away from the average have been removed. This is to help determine if a small percentage of the values are extreme which can skew the average. |
| Condition | Processor(*)% DPC Time | Min | Avg | Max | Hourly Trend | Std Deviation | 10% of Outliers Removed | 20% of Outliers Removed | 30% of Outliers Removed |
|---|---|---|---|---|---|---|---|---|---|
| OK | VIEWCS1/_Total | 0 | 0 | 0 | 0 | 0 | 0 | 0 | 0 |
| OK | VIEWCS1/0 | 0 | 0 | 0 | 0 | 0 | 0 | 0 | 0 |
| OK | VIEWCS1/1 | 0 | 0 | 0 | 0 | 0 | 0 | 0 | 0 |
Alerts
| An alert is generated if any of the thresholds were broken during one of the time ranges analyzed. The background of each of the values represents the highest priority threshold that the value broke. See each of the counter’s respective analysis section for more details about what the threshold means. |
| No Alerts Found |
|---|
Processor % User Time
Description: % User Time is the percentage of elapsed time the processor spends in the user mode. User mode is a restricted processing mode designed for applications, environment subsystems, and integral subsystems. The alternative, privileged mode, is designed for operating system components and allows direct access to hardware and all memory. The operating system switches application threads to privileged mode to access operating system services. This counter displays the average busy time as a percentage of the sample time.
This analysis provides statistics only. Threads running on a processor will be in either user mode measured using % User Time or in priviledge/kernel mode measured using % Privileged Time. High % User Time indicates a high amount of application code is being executed. This is desirable versus too much time in privileged mode. See the Processor % Privileged Time analysis for more information.


Overall Counter Instance Statistics
| Overall statistics of each of the counter instances. Min, Avg, and Max are the minimum, average, and Maximum values in the entire log. Hourly Trend is the calculated hourly slope of the entire log. 10%, 20%, and 30% of Outliers Removed is the average of the values after the percentage of outliers furthest away from the average have been removed. This is to help determine if a small percentage of the values are extreme which can skew the average. |
| Condition | Processor(*)% User Time | Min | Avg | Max | Hourly Trend | Std Deviation | 10% of Outliers Removed | 20% of Outliers Removed | 30% of Outliers Removed |
|---|---|---|---|---|---|---|---|---|---|
| No Thresholds | VIEWCS1/_Total | 0 | 1 | 4 | 0 | 1 | 1 | 1 | 1 |
| No Thresholds | VIEWCS1/0 | 1 | 2 | 4 | -28 | 1 | 1 | 1 | 1 |
| No Thresholds | VIEWCS1/1 | 0 | 1 | 5 | 0 | 1 | 0 | 0 | 0 |
Alerts
| An alert is generated if any of the thresholds were broken during one of the time ranges analyzed. The background of each of the values represents the highest priority threshold that the value broke. See each of the counter’s respective analysis section for more details about what the threshold means. |
| No Alerts Found |
|---|
Processor DPC Rate
Description: DPC Rate is the rate at which deferred procedure calls (DPCs) were added to the processors DPC queues between the timer ticks of the processor clock. DPCs are interrupts that run at alower priority than standard interrupts. Each processor has its own DPC queue. This counter measures the rate that DPCs were added to the queue, not the number of DPCs in the queue. This counter displays the last observed value only; it is not an average.
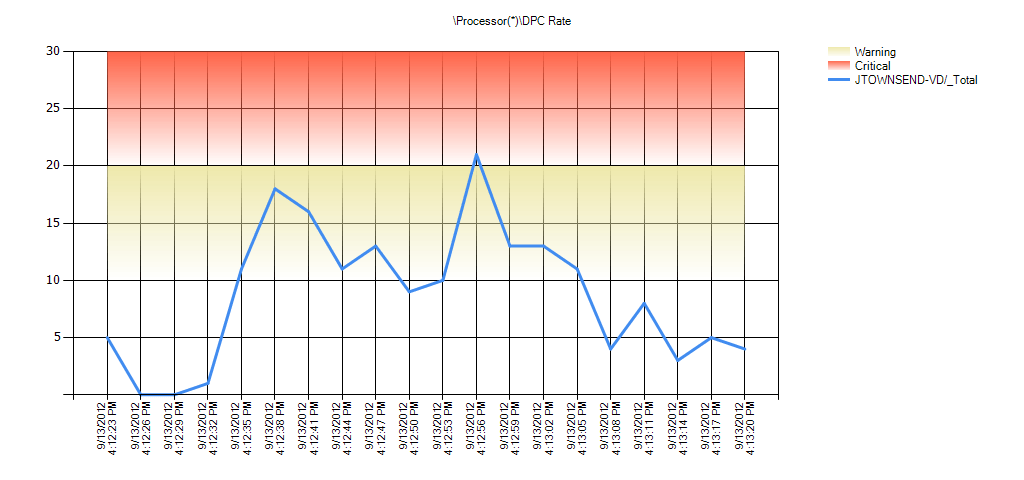

Overall Counter Instance Statistics
| Overall statistics of each of the counter instances. Min, Avg, and Max are the minimum, average, and Maximum values in the entire log. Hourly Trend is the calculated hourly slope of the entire log. 10%, 20%, and 30% of Outliers Removed is the average of the values after the percentage of outliers furthest away from the average have been removed. This is to help determine if a small percentage of the values are extreme which can skew the average. |
| Condition | Processor(*)DPC Rate | Min | Avg | Max | Hourly Trend | Std Deviation | 10% of Outliers Removed | 20% of Outliers Removed | 30% of Outliers Removed |
|---|---|---|---|---|---|---|---|---|---|
| No Thresholds | VIEWCS1/_Total | 0 | 2 | 7 | -56 | 2 | 1 | 0 | 0 |
| No Thresholds | VIEWCS1/0 | 0 | 1 | 6 | 84 | 2 | 0 | 0 | 0 |
| No Thresholds | VIEWCS1/1 | 0 | 1 | 5 | -141 | 1 | 0 | 0 | 0 |
Alerts
| An alert is generated if any of the thresholds were broken during one of the time ranges analyzed. The background of each of the values represents the highest priority threshold that the value broke. See each of the counter’s respective analysis section for more details about what the threshold means. |
| No Alerts Found |
|---|
Processor Information |
Processor Information Parking Status
Description: Parking Status represents whether a processor is parked or not.


Overall Counter Instance Statistics
| Overall statistics of each of the counter instances. Min, Avg, and Max are the minimum, average, and Maximum values in the entire log. Hourly Trend is the calculated hourly slope of the entire log. 10%, 20%, and 30% of Outliers Removed is the average of the values after the percentage of outliers furthest away from the average have been removed. This is to help determine if a small percentage of the values are extreme which can skew the average. |
| Condition | Processor Information(*)Parking Status | Min | Avg | Max | Hourly Trend | Std Deviation | 10% of Outliers Removed | 20% of Outliers Removed | 30% of Outliers Removed |
|---|---|---|---|---|---|---|---|---|---|
| No Thresholds | VIEWCS1/_Total | 0 | 0 | 0 | 0 | 0 | 0 | 0 | 0 |
| No Thresholds | VIEWCS1/0,_Total | 0 | 0 | 0 | 0 | 0 | 0 | 0 | 0 |
| No Thresholds | VIEWCS1/0,0 | 0 | 0 | 0 | 0 | 0 | 0 | 0 | 0 |
| No Thresholds | VIEWCS1/0,1 | 0 | 1 | 1 | 0 | 0 | 1 | 1 | 1 |
Alerts
| An alert is generated if any of the thresholds were broken during one of the time ranges analyzed. The background of each of the values represents the highest priority threshold that the value broke. See each of the counter’s respective analysis section for more details about what the threshold means. |
| No Alerts Found |
|---|
Processor Information % of Maximum Frequency
Description: % of Maximum Frequency is the percentage of the current processor’s maximum frequency.


Overall Counter Instance Statistics
| Overall statistics of each of the counter instances. Min, Avg, and Max are the minimum, average, and Maximum values in the entire log. Hourly Trend is the calculated hourly slope of the entire log. 10%, 20%, and 30% of Outliers Removed is the average of the values after the percentage of outliers furthest away from the average have been removed. This is to help determine if a small percentage of the values are extreme which can skew the average. |
| Condition | Processor Information(*)% of Maximum Frequency | Min | Avg | Max | Hourly Trend | Std Deviation | 10% of Outliers Removed | 20% of Outliers Removed | 30% of Outliers Removed |
|---|---|---|---|---|---|---|---|---|---|
| No Thresholds | VIEWCS1/_Total | 0 | 0 | 0 | 0 | 0 | 0 | 0 | 0 |
| No Thresholds | VIEWCS1/0,_Total | 0 | 0 | 0 | 0 | 0 | 0 | 0 | 0 |
| No Thresholds | VIEWCS1/0,0 | 100 | 100 | 100 | 0 | 0 | 100 | 100 | 100 |
| No Thresholds | VIEWCS1/0,1 | 100 | 100 | 100 | 0 | 0 | 100 | 100 | 100 |
Alerts
| An alert is generated if any of the thresholds were broken during one of the time ranges analyzed. The background of each of the values represents the highest priority threshold that the value broke. See each of the counter’s respective analysis section for more details about what the threshold means. |
| No Alerts Found |
|---|
Server |
Server Pool Nonpaged Failures
Description: The number of times allocations from nonpaged pool have failed. Indicates that the computer’s physical memory is too small.

Overall Counter Instance Statistics
| Overall statistics of each of the counter instances. Min, Avg, and Max are the minimum, average, and Maximum values in the entire log. Hourly Trend is the calculated hourly slope of the entire log. 10%, 20%, and 30% of Outliers Removed is the average of the values after the percentage of outliers furthest away from the average have been removed. This is to help determine if a small percentage of the values are extreme which can skew the average. |
| Condition | ServerPool Nonpaged Failures | Min | Avg | Max | Hourly Trend | Std Deviation | 10% of Outliers Removed | 20% of Outliers Removed | 30% of Outliers Removed |
|---|---|---|---|---|---|---|---|---|---|
| No Thresholds | VIEWCS1 | 0 | 0 | 0 | 0 | 0 | 0 | 0 | 0 |
Alerts
| An alert is generated if any of the thresholds were broken during one of the time ranges analyzed. The background of each of the values represents the highest priority threshold that the value broke. See each of the counter’s respective analysis section for more details about what the threshold means. |
| No Alerts Found |
|---|
Server Pool Paged Failures
Description: The number of times allocations from paged pool have failed. Indicates that the computer’s physical memory or paging file are too small.

Overall Counter Instance Statistics
| Overall statistics of each of the counter instances. Min, Avg, and Max are the minimum, average, and Maximum values in the entire log. Hourly Trend is the calculated hourly slope of the entire log. 10%, 20%, and 30% of Outliers Removed is the average of the values after the percentage of outliers furthest away from the average have been removed. This is to help determine if a small percentage of the values are extreme which can skew the average. |
| Condition | ServerPool Paged Failures | Min | Avg | Max | Hourly Trend | Std Deviation | 10% of Outliers Removed | 20% of Outliers Removed | 30% of Outliers Removed |
|---|---|---|---|---|---|---|---|---|---|
| No Thresholds | VIEWCS1 | 0 | 0 | 0 | 0 | 0 | 0 | 0 | 0 |
Alerts
| An alert is generated if any of the thresholds were broken during one of the time ranges analyzed. The background of each of the values represents the highest priority threshold that the value broke. See each of the counter’s respective analysis section for more details about what the threshold means. |
| No Alerts Found |
|---|
System |
System Processor Queue Length
Description: Processor Queue Length (PQL) is the number of threads in the processor queue. Unlike the disk counters, this counter shows ready threads only, not threads that are running. There is a single queue for processor time even on computers with multiple processors. Therefore, if a computer has multiple processors, you need to divide this value by the number of processors servicing the workload. A sustained processor queue of less than 10 threads per processor is normally acceptable, dependent of the workload.
This analysis determines if the average processor queue length exceeds the number of processors. If so, then this could indicate a processor bottleneck. Use this analysis in correlation with Privileged Mode CPU Analysis and Excessive Processor Use by Process analysis.
Note: Due to the way in which this counter is collected, ignore this counter and alerts for it when collected from a virtual computer.
If there are more tasks ready to run than there are processors, threads queue up. The processor queue is the collection of threads that are ready but not able to be executed by the processor because another active thread is currently executing. A sustained or recurring queue of more threads than number of processors is a good indication of a processor bottleneck.
You can use this counter in conjunction with the Processor% Processor Time counter to determine if your application can benefit from more CPUs.
Reference:

Overall Counter Instance Statistics
| Overall statistics of each of the counter instances. Min, Avg, and Max are the minimum, average, and Maximum values in the entire log. Hourly Trend is the calculated hourly slope of the entire log. 10%, 20%, and 30% of Outliers Removed is the average of the values after the percentage of outliers furthest away from the average have been removed. This is to help determine if a small percentage of the values are extreme which can skew the average. |
| Condition | SystemProcessor Queue Length | Min | Avg | Max | Hourly Trend | Std Deviation | 10% of Outliers Removed | 20% of Outliers Removed | 30% of Outliers Removed |
|---|---|---|---|---|---|---|---|---|---|
| OK | VIEWCS1 | 0 | 0 | 0 | 0 | 0 | 0 | 0 | 0 |
Alerts
| An alert is generated if any of the thresholds were broken during one of the time ranges analyzed. The background of each of the values represents the highest priority threshold that the value broke. See each of the counter’s respective analysis section for more details about what the threshold means. |
| No Alerts Found |
|---|
System High Context Switching
Description:
Context Switches/sec is the combined rate at which all processors on the computer are switched from one thread to another. Context switches occur when a running thread voluntarily relinquishes the processor, is preempted by a higher priority ready thread, or switches between user-mode and privileged (kernel) mode to use an Executive or subsystem service. It is the sum of ThreadContext Switches/sec for all threads running on all processors in the computer and is measured in numbers of switches. There are context switch counters on the System and Thread objects. This counter displays the difference between the values observed in the last two samples, divided by the duration of the sample interval.High context switching is only a problem if overall CPU is high as well. This analysis checks for high CPU, high privileged mode CPU, and high system context switches per sec.
Threshold: As a general rule, context switching rates of greater than 5,000 per second per processor are considered a warning. If context switching rates exceed 10,000 per second per processor, then there is a constraint.
Significance: Context switching happens when a higher priority thread preempts a lower priority thread that is currently running or when a high priority thread blocks. High levels of context switching can occur when many threads share the same priority level. This often indicates that there are too many threads competing for the processors on the system. If you do not see much processor utilization and you see very low levels of context switching, it could indicate that threads are blocked.
Reference:
Measuring .NET Application Performance

Overall Counter Instance Statistics
| Overall statistics of each of the counter instances. Min, Avg, and Max are the minimum, average, and Maximum values in the entire log. Hourly Trend is the calculated hourly slope of the entire log. 10%, 20%, and 30% of Outliers Removed is the average of the values after the percentage of outliers furthest away from the average have been removed. This is to help determine if a small percentage of the values are extreme which can skew the average. |
| Condition | SystemContext Switches/sec | Min | Avg | Max | Hourly Trend | Std Deviation | 10% of Outliers Removed | 20% of Outliers Removed | 30% of Outliers Removed |
|---|---|---|---|---|---|---|---|---|---|
| OK | VIEWCS1 | 1,251 | 1,429 | 1,749 | 3,853 | 133 | 1,391 | 1,378 | 1,362 |
Alerts
| An alert is generated if any of the thresholds were broken during one of the time ranges analyzed. The background of each of the values represents the highest priority threshold that the value broke. See each of the counter’s respective analysis section for more details about what the threshold means. |
| No Alerts Found |
|---|
System System Calls/sec
Description: System Calls/sec is the combined rate of calls to operating system service routines by all processes running on the computer. These routines perform all of the basic scheduling and synchronization of activities on the computer, and provide access to non-graphic devices, memory management, and name space management. This counter displays the difference between the values observed in the last two samples, divided by the duration of the sample interval.

Overall Counter Instance Statistics
| Overall statistics of each of the counter instances. Min, Avg, and Max are the minimum, average, and Maximum values in the entire log. Hourly Trend is the calculated hourly slope of the entire log. 10%, 20%, and 30% of Outliers Removed is the average of the values after the percentage of outliers furthest away from the average have been removed. This is to help determine if a small percentage of the values are extreme which can skew the average. |
| Condition | SystemSystem Calls/sec | Min | Avg | Max | Hourly Trend | Std Deviation | 10% of Outliers Removed | 20% of Outliers Removed | 30% of Outliers Removed |
|---|---|---|---|---|---|---|---|---|---|
| No Thresholds | VIEWCS1 | 3,934 | 10,054 | 83,675 | 2,202,019 | 19,004 | 5,255 | 5,138 | 4,964 |
Alerts
| An alert is generated if any of the thresholds were broken during one of the time ranges analyzed. The background of each of the values represents the highest priority threshold that the value broke. See each of the counter’s respective analysis section for more details about what the threshold means. |
| No Alerts Found |
|---|
TCPv4 |
TCPv4 Connection Failures
Description: Connection Failures is the number of times TCP connections have made a direct transition to the CLOSED state from the SYN-SENT state or the SYN-RCVD state, plus the number of times TCP connections have made a direct transition to the LISTEN state from the SYN-RCVD state.

Overall Counter Instance Statistics
| Overall statistics of each of the counter instances. Min, Avg, and Max are the minimum, average, and Maximum values in the entire log. Hourly Trend is the calculated hourly slope of the entire log. 10%, 20%, and 30% of Outliers Removed is the average of the values after the percentage of outliers furthest away from the average have been removed. This is to help determine if a small percentage of the values are extreme which can skew the average. |
| Condition | TCPv4Connection Failures | Min | Avg | Max | Hourly Trend | Std Deviation | 10% of Outliers Removed | 20% of Outliers Removed | 30% of Outliers Removed |
|---|---|---|---|---|---|---|---|---|---|
| More than 10 TCP connection failures per hour | VIEWCS1 | 630 | 632 | 633 | 84 | 1 | 632 | 631 | 631 |
Alerts
| An alert is generated if any of the thresholds were broken during one of the time ranges analyzed. The background of each of the values represents the highest priority threshold that the value broke. See each of the counter’s respective analysis section for more details about what the threshold means. |
| Time Range | ||||||
|---|---|---|---|---|---|---|
| 9/25/2012 11:30:21 AM – 9/25/2012 11:30:36 AM | Condition | Counter | Min | Avg | Max | Hourly Trend |
| More than 10 TCP connection failures per hour | VIEWCS1TCPv4Connection Failures | 631 | 631 | 631 | 225 | |
| 9/25/2012 11:30:36 AM – 9/25/2012 11:30:51 AM | Condition | Counter | Min | Avg | Max | Hourly Trend |
| More than 10 TCP connection failures per hour | VIEWCS1TCPv4Connection Failures | 631 | 631 | 631 | 150 | |
| 9/25/2012 11:30:51 AM – 9/25/2012 11:31:06 AM | Condition | Counter | Min | Avg | Max | Hourly Trend |
| More than 10 TCP connection failures per hour | VIEWCS1TCPv4Connection Failures | 631 | 631 | 631 | 112 | |
| 9/25/2012 11:31:06 AM – 9/25/2012 11:31:21 AM | Condition | Counter | Min | Avg | Max | Hourly Trend |
| More than 10 TCP connection failures per hour | VIEWCS1TCPv4Connection Failures | 631 | 631 | 631 | 90 | |
| 9/25/2012 11:31:21 AM – 9/25/2012 11:31:36 AM | Condition | Counter | Min | Avg | Max | Hourly Trend |
| More than 10 TCP connection failures per hour | VIEWCS1TCPv4Connection Failures | 631 | 631 | 631 | 75 | |
| 9/25/2012 11:31:36 AM – 9/25/2012 11:31:51 AM | Condition | Counter | Min | Avg | Max | Hourly Trend |
| More than 10 TCP connection failures per hour | VIEWCS1TCPv4Connection Failures | 631 | 631 | 631 | 64 | |
| 9/25/2012 11:31:51 AM – 9/25/2012 11:32:06 AM | Condition | Counter | Min | Avg | Max | Hourly Trend |
| More than 10 TCP connection failures per hour | VIEWCS1TCPv4Connection Failures | 632 | 632 | 632 | 112 | |
| 9/25/2012 11:32:06 AM – 9/25/2012 11:32:21 AM | Condition | Counter | Min | Avg | Max | Hourly Trend |
| More than 10 TCP connection failures per hour | VIEWCS1TCPv4Connection Failures | 632 | 632 | 632 | 100 | |
| 9/25/2012 11:32:21 AM – 9/25/2012 11:32:36 AM | Condition | Counter | Min | Avg | Max | Hourly Trend |
| More than 10 TCP connection failures per hour | VIEWCS1TCPv4Connection Failures | 632 | 632 | 632 | 90 | |
| 9/25/2012 11:32:36 AM – 9/25/2012 11:32:51 AM | Condition | Counter | Min | Avg | Max | Hourly Trend |
| More than 10 TCP connection failures per hour | VIEWCS1TCPv4Connection Failures | 632 | 632 | 632 | 82 | |
| 9/25/2012 11:32:51 AM – 9/25/2012 11:33:06 AM | Condition | Counter | Min | Avg | Max | Hourly Trend |
| More than 10 TCP connection failures per hour | VIEWCS1TCPv4Connection Failures | 632 | 632 | 632 | 75 | |
| 9/25/2012 11:33:06 AM – 9/25/2012 11:33:21 AM | Condition | Counter | Min | Avg | Max | Hourly Trend |
| More than 10 TCP connection failures per hour | VIEWCS1TCPv4Connection Failures | 633 | 633 | 633 | 104 | |
| 9/25/2012 11:33:21 AM – 9/25/2012 11:33:36 AM | Condition | Counter | Min | Avg | Max | Hourly Trend |
| More than 10 TCP connection failures per hour | VIEWCS1TCPv4Connection Failures | 633 | 633 | 633 | 96 | |
| 9/25/2012 11:33:36 AM – 9/25/2012 11:33:51 AM | Condition | Counter | Min | Avg | Max | Hourly Trend |
| More than 10 TCP connection failures per hour | VIEWCS1TCPv4Connection Failures | 633 | 633 | 633 | 90 | |
| 9/25/2012 11:33:51 AM – 9/25/2012 11:33:59 AM | Condition | Counter | Min | Avg | Max | Hourly Trend |
| More than 10 TCP connection failures per hour | VIEWCS1TCPv4Connection Failures | 633 | 633 | 633 | 84 |
VM Memory |
Memory Active in MB
Description: Amount of memory that is actively used by the virtual machine, as estimated by VMkernel based on recently touched memory pages.
A large delta between memory active and vRAM allocated could indicate over-sized VM’s. Consider reducing memory allocation to VM’s and monitor.
See https://www.vmware.com/files/pdf/perf-vsphere-memory_management.pdf for information on how VMware manages memory!!!

Overall Counter Instance Statistics
| Overall statistics of each of the counter instances. Min, Avg, and Max are the minimum, average, and Maximum values in the entire log. Hourly Trend is the calculated hourly slope of the entire log. 10%, 20%, and 30% of Outliers Removed is the average of the values after the percentage of outliers furthest away from the average have been removed. This is to help determine if a small percentage of the values are extreme which can skew the average. |
| Condition | VM MemoryMemory Active in MB | Min | Avg | Max | Hourly Trend | Std Deviation | 10% of Outliers Removed | 20% of Outliers Removed | 30% of Outliers Removed |
|---|---|---|---|---|---|---|---|---|---|
| No Thresholds | VIEWCS1 | 614 | 757 | 860 | 0 | 107 | 744 | 728 | 718 |
Alerts
| An alert is generated if any of the thresholds were broken during one of the time ranges analyzed. The background of each of the values represents the highest priority threshold that the value broke. See each of the counter’s respective analysis section for more details about what the threshold means. |
| No Alerts Found |
|---|
Memory Ballooned in MB
Description: The amount of memory that has been reclaimed from this virtual machine via the VMware Memory Balloon mechanism.
When VMware tools are installed on a virtual machine they provide device drivers into the host virtualization layer, from within the guest operating system. Part of this package that is installed is the balloon driver or “vmmemctl” which can be observed inside the guest. The balloon driver communicates to the hypervisor to reclaim memory inside the guest when it is no longer valuable to the operating system. If the Physical ESX server begins to run low on memory it will grow the balloon driver to reclaim memory from the guest. This process reduces the chance that the physical ESX host will begin to swap, which you will cause performance degradation.
Ballooning indicates that your ESXi hosts have some memory contention. In general, a little bit of ballooning is not bad. Ballooning at a low level allows ESXi to reclaim inactive memory pages from guest VM’s. However, if there are not enough inactive pages to claim, active pages may be reclaimed. This can hurt performance of the guest VM.
Resolution
- Verify Distributed Resource Scheduler is enabled on your cluster. DRS can redistribute VM’s from over-subscribed hosts to less busy hosts.
- Install more memory in physical hosts.
- Change the power policy of VMware View pools to suspend or power-off to conserve host resources. Note: this is at the expense of increased logon times for users.
- Add additional hosts to cluster. Note configuration maximums of 8 hosts per cluster in older versions of vSphere and View when using VMFS-based Linked Clones.
- Reduce the amount of memory given to View desktops. Review the Memory Active in MB counter (above). If memory active is substantially below configured memory, reduce the amount of memory given to desktops. Recommended starting values are 2GB for XP, 2GB for Win7 x86 and 3GB for Win7 x64.
See https://www.virtualinsanity.com/index.php/2010/02/19/performance-troubleshooting-vmware-vsphere-memory/ for more.

Overall Counter Instance Statistics
| Overall statistics of each of the counter instances. Min, Avg, and Max are the minimum, average, and Maximum values in the entire log. Hourly Trend is the calculated hourly slope of the entire log. 10%, 20%, and 30% of Outliers Removed is the average of the values after the percentage of outliers furthest away from the average have been removed. This is to help determine if a small percentage of the values are extreme which can skew the average. |
| Condition | VM MemoryMemory Ballooned in MB | Min | Avg | Max | Hourly Trend | Std Deviation | 10% of Outliers Removed | 20% of Outliers Removed | 30% of Outliers Removed |
|---|---|---|---|---|---|---|---|---|---|
| No Thresholds | VIEWCS1 | 0 | 0 | 0 | 0 | 0 | 0 | 0 | 0 |
Alerts
| An alert is generated if any of the thresholds were broken during one of the time ranges analyzed. The background of each of the values represents the highest priority threshold that the value broke. See each of the counter’s respective analysis section for more details about what the threshold means. |
| No Alerts Found |
|---|
Memory Limit in MB
Description: The maximum amount of memory that is allowed to the virtual machine. Assigning a Memory Limit ensures that this virtual machine never consumes more than a certain amount of the allowed memory. By limiting the amount of memory consumed, a portion of this shared resource is allowed to other virtual machines.
In vSphere, it’s possible to set memory limits that define a maximum quantity of memory a VM is allowed to consume. You might want to set such limits to protect physical memory from being over-consumed by a memory-hungry VM.
However, if you don’t plan carefully, setting a VM memory limit can have an unexpected impact on VM performance. That impact occurs because the VM is unaware that a limit has been placed upon it. A limited VM with 4GB of assigned vRAM operates under the assumption that it has its full memory assignment. As it attempts to use more memory than its limit, that memory must come from ballooning or swapping. Either of these actions can incur a performance tax on the host, which can impact the performance of other VMs on that host.It’s generally not a good idea to set memory limits on VMs. Instead, you should adjust downward the quantity of vRAM assigned to that VM.
The Memory Limit value shown below should be equal to the amount of vRAM allocated to your View desktop. If the value is less than vRAM assigned, you are limited.

Overall Counter Instance Statistics
| Overall statistics of each of the counter instances. Min, Avg, and Max are the minimum, average, and Maximum values in the entire log. Hourly Trend is the calculated hourly slope of the entire log. 10%, 20%, and 30% of Outliers Removed is the average of the values after the percentage of outliers furthest away from the average have been removed. This is to help determine if a small percentage of the values are extreme which can skew the average. |
| Condition | VM MemoryMemory Limit in MB | Min | Avg | Max | Hourly Trend | Std Deviation | 10% of Outliers Removed | 20% of Outliers Removed | 30% of Outliers Removed |
|---|---|---|---|---|---|---|---|---|---|
| No Thresholds | VIEWCS1 | 4,294,967,295 | 4,294,967,295 | 4,294,967,295 | 0 | 0 | 4,294,967,295 | 4,294,967,295 | 4,294,967,295 |
Alerts
| An alert is generated if any of the thresholds were broken during one of the time ranges analyzed. The background of each of the values represents the highest priority threshold that the value broke. See each of the counter’s respective analysis section for more details about what the threshold means. |
| No Alerts Found |
|---|
Memory Mapped in MB
Description: The mapped memory size of this virtual machine. This is the current total amount of guest memory that is backed by physical memory. Note that this number may include pages of memory shared between multiple virtual machines and thus may be an overestimate of the amount of physical host memory *consumed* by this virtual machine.

Overall Counter Instance Statistics
| Overall statistics of each of the counter instances. Min, Avg, and Max are the minimum, average, and Maximum values in the entire log. Hourly Trend is the calculated hourly slope of the entire log. 10%, 20%, and 30% of Outliers Removed is the average of the values after the percentage of outliers furthest away from the average have been removed. This is to help determine if a small percentage of the values are extreme which can skew the average. |
| Condition | VM MemoryMemory Mapped in MB | Min | Avg | Max | Hourly Trend | Std Deviation | 10% of Outliers Removed | 20% of Outliers Removed | 30% of Outliers Removed |
|---|---|---|---|---|---|---|---|---|---|
| No Thresholds | VIEWCS1 | 6,144 | 6,144 | 6,144 | 0 | 0 | 6,144 | 6,144 | 6,144 |
Alerts
| An alert is generated if any of the thresholds were broken during one of the time ranges analyzed. The background of each of the values represents the highest priority threshold that the value broke. See each of the counter’s respective analysis section for more details about what the threshold means. |
| No Alerts Found |
|---|
Memory Overhead in MB
Description: The amount of overhead memory associated with this virtual machine consumed on the host system. Once a virtual machine is powered on the ESX host reserves memory for the the normal operations of VMware infrastructure. This memory can’t be used for swapping or ballooning, and is reserved for the system. Bigger VM’s require more overhead to run.
See this page for vSphere 5 overhead values: https://pubs.vmware.com/vsphere-50/index.jsp?topic=%2Fcom.vmware.vsphere.resmgmt.doc_50%2FGUID-B42C72C1-F8D5-40DC-93D1-FB31849B1114.html
If you chronically oversize your VM’s, the overhead consumed will increase. This leads to a less efficient datacenter and reduced resources for running VM’s as overhead memory cannot be shared, swapped or ballooned. Right-size your VM’s.

Overall Counter Instance Statistics
| Overall statistics of each of the counter instances. Min, Avg, and Max are the minimum, average, and Maximum values in the entire log. Hourly Trend is the calculated hourly slope of the entire log. 10%, 20%, and 30% of Outliers Removed is the average of the values after the percentage of outliers furthest away from the average have been removed. This is to help determine if a small percentage of the values are extreme which can skew the average. |
| Condition | VM MemoryMemory Overhead in MB | Min | Avg | Max | Hourly Trend | Std Deviation | 10% of Outliers Removed | 20% of Outliers Removed | 30% of Outliers Removed |
|---|---|---|---|---|---|---|---|---|---|
| No Thresholds | VIEWCS1 | 72 | 72 | 72 | 0 | 0 | 72 | 72 | 72 |
Alerts
| An alert is generated if any of the thresholds were broken during one of the time ranges analyzed. The background of each of the values represents the highest priority threshold that the value broke. See each of the counter’s respective analysis section for more details about what the threshold means. |
| No Alerts Found |
|---|
Memory Reservation in MB
Description: The minimum amount of memory that is guaranteed to the virtual machine. Assigning a Memory Reservation ensures that even as other virtual machines on the same host consume memory, there is still a certain minimum amount for this virtual machine.
Reservations may be used in View environments to reduce the footprint of VM’s on disk as reserved memory is included in the .vswap file written to disk for each VM.
A small reservation on the parent VM can also help ensure that each VM in the pool has at least a little bit of vRAM to work in heavily oversubscribed environments. Take care to not over reserve resources in your environment – do not reserve 100% of memory for each View desktop.
Starting values for View desktop reservations might be around 10%. For example, If reserving 10% of a 2GB desktop, our vswap is reduced by 205MB per desktop. On a 200 desktop deployment, this can lead to 41GB disk savings (205mb * 200). 205mb reserved memory will probably be enough to keep a Windows desktop running (barely) even if all other memory is ballooned or swapped out if you failed to plan and over-over-subscribed your environment.
Note: This example 41GB of disk savings will be lost to reserved ESXi host RAM across the cluster. You will not be able to use this host RAM, even if the VM’s with reserved memory are totally idle. This can exacerbate problems caused by oversubscription. To mitigate this impact, consider setting your View pools where you have set a reservation to have a powered-off power policy. A suspend power policy will consume disk space, negating the savings you were trying to achieve by reserving memory.

Overall Counter Instance Statistics
| Overall statistics of each of the counter instances. Min, Avg, and Max are the minimum, average, and Maximum values in the entire log. Hourly Trend is the calculated hourly slope of the entire log. 10%, 20%, and 30% of Outliers Removed is the average of the values after the percentage of outliers furthest away from the average have been removed. This is to help determine if a small percentage of the values are extreme which can skew the average. |
| Condition | VM MemoryMemory Reservation in MB | Min | Avg | Max | Hourly Trend | Std Deviation | 10% of Outliers Removed | 20% of Outliers Removed | 30% of Outliers Removed |
|---|---|---|---|---|---|---|---|---|---|
| No Thresholds | VIEWCS1 | 0 | 0 | 0 | 0 | 0 | 0 | 0 | 0 |
Alerts
| An alert is generated if any of the thresholds were broken during one of the time ranges analyzed. The background of each of the values represents the highest priority threshold that the value broke. See each of the counter’s respective analysis section for more details about what the threshold means. |
| No Alerts Found |
|---|
Memory Shared in MB
Description: The amount of physical memory associated with this virtual machine that is copy-on-write (COW) shared on the host.
Sharing is good!
In View environments, most running VM’s will share a common image, especially with Linked Clone pools where all VM’s are running against a common base disk.
Read more about Transparent Page Sharing (TPS) in View environemnts here: https://myvirtualcloud.net/?p=1797 and here: https://myvirtualcloud.net/?p=2545.
When multiple virtual machines are running, some of them may have identical sets of memory content. This presents opportunities for sharing memory across virtual machines (as well as sharing within a single virtual machine). For example, several virtual machines may be running the same guest operating system, have the same applications, or contain the same user data. With page sharing,the hypervisor can reclaim the redundant copies and only keep one copy, which is shared by multiple virtual machines in the hostphysical memory. As a result, the total virtual machine host memory consumption is reduced and a higher level of memory overcommitment is possible.
In ESXi, the redundant page copies are identified by their contents. This means that pages with identical content can be shared regardless of when, where, and how those contents are generated. ESX scans the content of guest physical memory for sharing opportunities. Instead of comparing each byte of a candidate guest physical page to other pages, an action that is prohibitively expensive, ESX uses hashing to identify potentially identical pages.

Overall Counter Instance Statistics
| Overall statistics of each of the counter instances. Min, Avg, and Max are the minimum, average, and Maximum values in the entire log. Hourly Trend is the calculated hourly slope of the entire log. 10%, 20%, and 30% of Outliers Removed is the average of the values after the percentage of outliers furthest away from the average have been removed. This is to help determine if a small percentage of the values are extreme which can skew the average. |
| Condition | VM MemoryMemory Shared in MB | Min | Avg | Max | Hourly Trend | Std Deviation | 10% of Outliers Removed | 20% of Outliers Removed | 30% of Outliers Removed |
|---|---|---|---|---|---|---|---|---|---|
| No Thresholds | VIEWCS1 | 0 | 0 | 0 | 0 | 0 | 0 | 0 | 0 |
Alerts
| An alert is generated if any of the thresholds were broken during one of the time ranges analyzed. The background of each of the values represents the highest priority threshold that the value broke. See each of the counter’s respective analysis section for more details about what the threshold means. |
| No Alerts Found |
|---|
Memory Shared Saved in MB
Description: The estimated amount of physical memory on the host saved from copy-on-write (COW) shared guest physical memory.
This shows the total amount of memory saved on the particular host this VM was running on. More is better. If this value is near zero (0), investigate your host configuration.
Review https://myvirtualcloud.net/?p=1328 for information on tuning TPS settings to drive higher levels of memory sharing per host.

Overall Counter Instance Statistics
| Overall statistics of each of the counter instances. Min, Avg, and Max are the minimum, average, and Maximum values in the entire log. Hourly Trend is the calculated hourly slope of the entire log. 10%, 20%, and 30% of Outliers Removed is the average of the values after the percentage of outliers furthest away from the average have been removed. This is to help determine if a small percentage of the values are extreme which can skew the average. |
| Condition | VM MemoryMemory Shared Saved in MB | Min | Avg | Max | Hourly Trend | Std Deviation | 10% of Outliers Removed | 20% of Outliers Removed | 30% of Outliers Removed |
|---|---|---|---|---|---|---|---|---|---|
| No Thresholds | VIEWCS1 | 0 | 0 | 0 | 0 | 0 | 0 | 0 | 0 |
Alerts
| An alert is generated if any of the thresholds were broken during one of the time ranges analyzed. The background of each of the values represents the highest priority threshold that the value broke. See each of the counter’s respective analysis section for more details about what the threshold means. |
| No Alerts Found |
|---|
Memory Shares
Description: The number of memory shares allocated to the virtual machine.
This value alone is not significant. Shares must be considered across all VM’s on the host, cluster, and resource pool, if used. If the VM with performance problems has a lower number of shares (or is in a resource pool with a lower number of shares, or oversubscribed shares (https://vmtoday.com/2012/03/vmware-vsphere-resource-pools-resource-allocation-revisited/) than other VM’s it may suffer performance degradation in environments where there is resource contention and/or memory oversubscription.
Shares play an important role in determining the allocation targets when memory is overcommitted. When the hypervisor needs memory, it reclaims memory from the virtual machine that owns the fewest shares-per-allocated page.
A significant limitation of the pure proportional-share algorithm is that it does not incorporate any information about the actual memory usage of the virtual machine. As a result, some idle virtual machines with high shares can retain idle memory unproductively, while some active virtual machines with fewer shares suffer from the lack of memory.
ESX resolves this problem by estimating a virtual machine’s working set size and charging a virtual machine more for the idle memory than for the actively used memory through an idle tax. A virtual machine’s shares-per-allocated page ratio is adjusted to be lower if a fraction of the virtual machine’s memory is idle. Hence, memory will be reclaimed preferentially from the virtual machines that are not fully utilizing their allocated memory. The detailed algorithm can be found in Memory Resource Management in VMware ESX Server.

Overall Counter Instance Statistics
| Overall statistics of each of the counter instances. Min, Avg, and Max are the minimum, average, and Maximum values in the entire log. Hourly Trend is the calculated hourly slope of the entire log. 10%, 20%, and 30% of Outliers Removed is the average of the values after the percentage of outliers furthest away from the average have been removed. This is to help determine if a small percentage of the values are extreme which can skew the average. |
| Condition | VM MemoryMemory Shares | Min | Avg | Max | Hourly Trend | Std Deviation | 10% of Outliers Removed | 20% of Outliers Removed | 30% of Outliers Removed |
|---|---|---|---|---|---|---|---|---|---|
| No Thresholds | VIEWCS1 | 61,440 | 61,440 | 61,440 | 0 | 0 | 61,440 | 61,440 | 61,440 |
Alerts
| An alert is generated if any of the thresholds were broken during one of the time ranges analyzed. The background of each of the values represents the highest priority threshold that the value broke. See each of the counter’s respective analysis section for more details about what the threshold means. |
| No Alerts Found |
|---|
Memory Swapped in MB
Description: The amount of memory associated with this virtual machine that has been swapped by ESX.
If this is much above zero for an active machine you’ve got problems. TPS and Ballooning have failed to provide sufficient memory for the host to use for other running VM’s because you are oversubscribed, so ESXi is now swapping to disk. Swapping is a slow operation and causes severe degradation of guest performance.
Resolution
- Verify Distributed Resource Scheduler is enabled on your cluster. DRS can redistribute VM’s from over-subscribed hosts to less busy hosts.
- Install more memory in physical hosts.
- Change the power policy of VMware View pools to suspend or power-off to conserve host resources. Note: this is at the expense of increased logon times for users.
- Add additional hosts to cluster. Note configuration maximums of 8 hosts per cluster in older versions of vSphere and View when using VMFS-based Linked Clones.
- Reduce the amount of memory given to View desktops. Review the Memory Active in MB counter (above). If memory active is substantially below configured memory, reduce the amount of memory given to desktops. Recommended starting values are 2GB for XP, 2GB for Win7 x86 and 3GB for Win7 x64.

Overall Counter Instance Statistics
| Overall statistics of each of the counter instances. Min, Avg, and Max are the minimum, average, and Maximum values in the entire log. Hourly Trend is the calculated hourly slope of the entire log. 10%, 20%, and 30% of Outliers Removed is the average of the values after the percentage of outliers furthest away from the average have been removed. This is to help determine if a small percentage of the values are extreme which can skew the average. |
| Condition | VM MemoryMemory Swapped in MB | Min | Avg | Max | Hourly Trend | Std Deviation | 10% of Outliers Removed | 20% of Outliers Removed | 30% of Outliers Removed |
|---|---|---|---|---|---|---|---|---|---|
| No Thresholds | VIEWCS1 | 0 | 0 | 0 | 0 | 0 | 0 | 0 | 0 |
Alerts
| An alert is generated if any of the thresholds were broken during one of the time ranges analyzed. The background of each of the values represents the highest priority threshold that the value broke. See each of the counter’s respective analysis section for more details about what the threshold means. |
| No Alerts Found |
|---|
Memory Used in MB
Description: The estimated amount of physical host memory currently consumed for this virtual machine’s physical memory. This is the same as ‘Memory Mapped in MB’ – ‘Memory Shared Saved in MB’.

Overall Counter Instance Statistics
| Overall statistics of each of the counter instances. Min, Avg, and Max are the minimum, average, and Maximum values in the entire log. Hourly Trend is the calculated hourly slope of the entire log. 10%, 20%, and 30% of Outliers Removed is the average of the values after the percentage of outliers furthest away from the average have been removed. This is to help determine if a small percentage of the values are extreme which can skew the average. |
| Condition | VM MemoryMemory Used in MB | Min | Avg | Max | Hourly Trend | Std Deviation | 10% of Outliers Removed | 20% of Outliers Removed | 30% of Outliers Removed |
|---|---|---|---|---|---|---|---|---|---|
| No Thresholds | VIEWCS1 | 6,144 | 6,144 | 6,144 | 0 | 0 | 6,144 | 6,144 | 6,144 |
Alerts
| An alert is generated if any of the thresholds were broken during one of the time ranges analyzed. The background of each of the values represents the highest priority threshold that the value broke. See each of the counter’s respective analysis section for more details about what the threshold means. |
| No Alerts Found |
|---|
VM Processor |
Limit in MHz
Description: The maximum processing power in MHz allowed to the virtual machine. Assigning a CPU Limit ensures that this virtual machine never consumes more than a certain amount of the available processor power. By limiting the amount of processing power consumed, a portion of the processing power becomes available to other virtual machines.
From VMware KB 1033115: When a CPU Limit is set on a virtual machine resource settings, the virtual machine is deliberately held from being scheduled to a PCPU when it has used up its allocated CPU resource. This happens regardless of the CPU utilization. If the limit is set to 500MHz, the virtual machine is descheduled from the PCPU and has to wait before it is allowed to be scheduled again. As such, the virtual machine might experience performance degradation.
Note: For an SMP virtual machine, the sum of all vCPUs cannot exceed the specified limit. For example, 4 vCPU virtual machine with a limit of 1200MHz and equal load among vCPUs would result in a max of 300MHz per vCPU.
Translated, this means that we’re not slowing down the pCPU for this VM – that’s not possible. What we are doing is basically artificially introducing CPU Ready (for more on CPU Ready see here: https://vmtoday.com/2010/08/high-cpu-ready-poor-performance/) for the VM.If the value shown here is less than the ‘Host Processor Speed in MHz’ value, you are limited. The default for VM’s is ‘unlimited’, which should appear as some unwieldy number in the range of terahertz or petahertz (not that your servers can do this).

Overall Counter Instance Statistics
| Overall statistics of each of the counter instances. Min, Avg, and Max are the minimum, average, and Maximum values in the entire log. Hourly Trend is the calculated hourly slope of the entire log. 10%, 20%, and 30% of Outliers Removed is the average of the values after the percentage of outliers furthest away from the average have been removed. This is to help determine if a small percentage of the values are extreme which can skew the average. |
| Condition | VM Processor(*)Limit in MHz | Min | Avg | Max | Hourly Trend | Std Deviation | 10% of Outliers Removed | 20% of Outliers Removed | 30% of Outliers Removed |
|---|---|---|---|---|---|---|---|---|---|
| No Thresholds | VIEWCS1/_Total | 4,294,967,295 | 4,294,967,295 | 4,294,967,295 | 0 | 0 | 4,294,967,295 | 4,294,967,295 | 4,294,967,295 |
Alerts
| An alert is generated if any of the thresholds were broken during one of the time ranges analyzed. The background of each of the values represents the highest priority threshold that the value broke. See each of the counter’s respective analysis section for more details about what the threshold means. |
| No Alerts Found |
|---|
Reservation in MHz
Description: The minimum processing power in MHz available to the virtual machine. Assigning a CPU Reservation ensures that even as other virtual machines on the same host consume shared processing power, there is still a certain minimum amount for this virtual machine.
See https://www.yellow-bricks.com/2010/07/08/reservations-primer/ and https://frankdenneman.nl/2010/06/reservations-and-cpu-scheduling/for more info on reservations.
In general, you should not be setting a reservation for Veiw desktops. There may be some unique use cases for reserving CPU for high-profile users’ desktops (CEO, CTO, your own admin console) in View. Do this sparingly, as reservations can limit the ESXi scheduler and make your virtual datacenter inefficient. CPU Reservations can introduce higher CPU ready for VM’s without reservations. Reservations may not solve CPU Ready issues for the VM’s they are set on either (https://joshodgers.com/2012/07/22/common-mistake-using-cpu-reservations-to-solve-cpu-ready/

Overall Counter Instance Statistics
| Overall statistics of each of the counter instances. Min, Avg, and Max are the minimum, average, and Maximum values in the entire log. Hourly Trend is the calculated hourly slope of the entire log. 10%, 20%, and 30% of Outliers Removed is the average of the values after the percentage of outliers furthest away from the average have been removed. This is to help determine if a small percentage of the values are extreme which can skew the average. |
| Condition | VM Processor(*)Reservation in MHz | Min | Avg | Max | Hourly Trend | Std Deviation | 10% of Outliers Removed | 20% of Outliers Removed | 30% of Outliers Removed |
|---|---|---|---|---|---|---|---|---|---|
| No Thresholds | VIEWCS1/_Total | 0 | 0 | 0 | 0 | 0 | 0 | 0 | 0 |
Alerts
| An alert is generated if any of the thresholds were broken during one of the time ranges analyzed. The background of each of the values represents the highest priority threshold that the value broke. See each of the counter’s respective analysis section for more details about what the threshold means. |
| No Alerts Found |
|---|
Shares
Description: The number of CPU shares allocated to the virtual machine.
Each virtual machine is granted a number of CPU shares. The more shares a virtual machine has, the more often it gets a time slice of a CPU when there is no CPU idle time. Shares represent a relative metric for allocating CPU capacity.
This value alone is not significant. Shares must be considered across all VM’s on the host, cluster, and resource pool, if used. If the VM with performance problems has a lower number of shares (or is in a resource pool with a lower number of shares, or oversubscribed shares (https://vmtoday.com/2012/03/vmware-vsphere-resource-pools-resource-allocation-revisited/) than other VM’s it may suffer performance degradation in environments where there is resource contention and/or memory oversubscription.
Read this VMware PDF for a deep-dive into CPU Scheduling: https://www.vmware.com/files/pdf/techpaper/VMW_vSphere41_cpu_schedule_ESX.pdf
If this value is variable (not a flat line), this may indicate that your VM is in a resource pool configured with a set number of shares. As your View environment dynamically spins up and down VM’s within the pool, the percentage of shares for a particular machine will vary. Understand the impact of shares, reservations and limits on VMs and Resource Pools!!!!

Overall Counter Instance Statistics
| Overall statistics of each of the counter instances. Min, Avg, and Max are the minimum, average, and Maximum values in the entire log. Hourly Trend is the calculated hourly slope of the entire log. 10%, 20%, and 30% of Outliers Removed is the average of the values after the percentage of outliers furthest away from the average have been removed. This is to help determine if a small percentage of the values are extreme which can skew the average. |
| Condition | VM Processor(*)Shares | Min | Avg | Max | Hourly Trend | Std Deviation | 10% of Outliers Removed | 20% of Outliers Removed | 30% of Outliers Removed |
|---|---|---|---|---|---|---|---|---|---|
| No Thresholds | VIEWCS1/_Total | 2,000 | 2,000 | 2,000 | 0 | 0 | 2,000 | 2,000 | 2,000 |
Alerts
| An alert is generated if any of the thresholds were broken during one of the time ranges analyzed. The background of each of the values represents the highest priority threshold that the value broke. See each of the counter’s respective analysis section for more details about what the threshold means. |
| No Alerts Found |
|---|
CPU stolen time
Description: The time (in ms) that the VM was runnable but not scheduled to run.
This is CPU Ready!!!
For more on CPU Ready see: https://vmtoday.com/2010/08/high-cpu-ready-poor-performance/
CPU Ready is often a sign of over subscribing CPU resources or over-sizing your virtual machines. This counter shows CPU Ready time as a percentage per milisecond that the CPU was ready to run but could not be scheduled by the ESXi Scheduler. Multiply by 100 to get percentage of CPU Ready. In general, anything above 10% CPU Ready will result in poor performance.
For more on Scheduling/Time Keeping in VM’s see: https://www.vmware.com/files/pdf/Timekeeping-In-VirtualMachines.pdf. Also see the vSphere Performance Monitoring Guide here: https://pubs.vmware.com/vsphere-50/topic/com.vmware.ICbase/PDF/vsphere-esxi-vcenter-server-50-monitoring-performance-guide.pdf
If this counter is in a warning or critical state, check CPU Ready for the host that this VM is running on in vCenter. The value in the realtime graph is a summation of miliseconds VM’s were ready but could not be scheduled. Divide the value shown in the vCenter ESXi Performance tab by the number of milisecond timeslices in the graph (realtime graph = 20 second refresh = 20000 slices). Example: If CPU ready is 5200 on the CPU/RealTime graph, divide 5200/20000 = .26 x 100 = 26% CPU RDY. Also check ESXTOP on the ESXi host that this VM is running on. If multiple VM’s show high CPU ready, you are over-provisioning VM’s with too many vCPU’s or have too high of a consolidation ration (too many VM’s per host). Remove vCPU’s or add additional pCPU’s or hosts.

Overall Counter Instance Statistics
| Overall statistics of each of the counter instances. Min, Avg, and Max are the minimum, average, and Maximum values in the entire log. Hourly Trend is the calculated hourly slope of the entire log. 10%, 20%, and 30% of Outliers Removed is the average of the values after the percentage of outliers furthest away from the average have been removed. This is to help determine if a small percentage of the values are extreme which can skew the average. |
| Condition | VM Processor(*)CPU stolen time | Min | Avg | Max | Hourly Trend | Std Deviation | 10% of Outliers Removed | 20% of Outliers Removed | 30% of Outliers Removed |
|---|---|---|---|---|---|---|---|---|---|
| No Thresholds | VIEWCS1/_Total | 0 | 0 | 0 | 0 | 0 | 0 | 0 | 0 |
Alerts
| An alert is generated if any of the thresholds were broken during one of the time ranges analyzed. The background of each of the values represents the highest priority threshold that the value broke. See each of the counter’s respective analysis section for more details about what the threshold means. |
| No Alerts Found |
|---|
% Processor Time
Description: Current load of the VM’s virtual processor(s).
This is the amount of time that the CPU is active. If the VM is using vSMP, this is the aggregate average of all CPU’s in the VM.
If this value is regularly over 70%, you may benefit from adding an additional vCPU. Be aware, however, that an additional CPU multiplied over all VM’s may drive CPU Ready upwards, negatively impacting performance.

Overall Counter Instance Statistics
| Overall statistics of each of the counter instances. Min, Avg, and Max are the minimum, average, and Maximum values in the entire log. Hourly Trend is the calculated hourly slope of the entire log. 10%, 20%, and 30% of Outliers Removed is the average of the values after the percentage of outliers furthest away from the average have been removed. This is to help determine if a small percentage of the values are extreme which can skew the average. |
| Condition | VM Processor(*)% Processor Time | Min | Avg | Max | Hourly Trend | Std Deviation | 10% of Outliers Removed | 20% of Outliers Removed | 30% of Outliers Removed |
|---|---|---|---|---|---|---|---|---|---|
| No Thresholds | VIEWCS1/_Total | 5 | 7 | 15 | -84 | 3 | 6 | 6 | 6 |
Alerts
| An alert is generated if any of the thresholds were broken during one of the time ranges analyzed. The background of each of the values represents the highest priority threshold that the value broke. See each of the counter’s respective analysis section for more details about what the threshold means. |
| No Alerts Found |
|---|
Effective VM Speed in MHz
Description: The approximate average effective speed of the VM’s virtual CPU over the time period between the two samples.
Remember, A VM’s vCPU cannot go any faster than the speed of a single core/thread of the physical CPU that’s backing it.

Overall Counter Instance Statistics
| Overall statistics of each of the counter instances. Min, Avg, and Max are the minimum, average, and Maximum values in the entire log. Hourly Trend is the calculated hourly slope of the entire log. 10%, 20%, and 30% of Outliers Removed is the average of the values after the percentage of outliers furthest away from the average have been removed. This is to help determine if a small percentage of the values are extreme which can skew the average. |
| Condition | VM Processor(*)Effective VM Speed in MHz | Min | Avg | Max | Hourly Trend | Std Deviation | 10% of Outliers Removed | 20% of Outliers Removed | 30% of Outliers Removed |
|---|---|---|---|---|---|---|---|---|---|
| No Thresholds | VIEWCS1/_Total | 88 | 146 | 634 | -12,853 | 127 | 111 | 102 | 101 |
Alerts
| An alert is generated if any of the thresholds were broken during one of the time ranges analyzed. The background of each of the values represents the highest priority threshold that the value broke. See each of the counter’s respective analysis section for more details about what the threshold means. |
| No Alerts Found |
|---|
Host processor speed in MHz
Description: Host Processor speed.
This is the clock speed of the physical processor backing the VM. If this value fluxuates, it could be due to a couple issues:
1.) vMotion of VM between hosts with different physical hardware. Best practice for VMware vSphere clusters suggests maintaining hosts with identical hardare configurations to prevent unpredictable performance as VM’s are vMotioned from host to host. Identical host configuration may also help VMware vSphere Distributed Resource Scheduler recommend best placement for VM’s.
2.) Power Management settings – if your host is configured with active/dynamic power management in BIOS. Consider setting a static ‘High Performance’ power management profile or disable power management in BIOS. See this VMware KB for more info: https://kb.vmware.com/selfservice/microsites/search.do?language=en_US&cmd=displayKC&externalId=1018206

Overall Counter Instance Statistics
| Overall statistics of each of the counter instances. Min, Avg, and Max are the minimum, average, and Maximum values in the entire log. Hourly Trend is the calculated hourly slope of the entire log. 10%, 20%, and 30% of Outliers Removed is the average of the values after the percentage of outliers furthest away from the average have been removed. This is to help determine if a small percentage of the values are extreme which can skew the average. |
| Condition | VM Processor(*)Host processor speed in MHz | Min | Avg | Max | Hourly Trend | Std Deviation | 10% of Outliers Removed | 20% of Outliers Removed | 30% of Outliers Removed |
|---|---|---|---|---|---|---|---|---|---|
| No Thresholds | VIEWCS1/_Total | 2,394 | 2,394 | 2,394 | 0 | 0 | 2,394 | 2,394 | 2,394 |
Alerts
| An alert is generated if any of the thresholds were broken during one of the time ranges analyzed. The background of each of the values represents the highest priority threshold that the value broke. See each of the counter’s respective analysis section for more details about what the threshold means. |
| No Alerts Found |
|---|
Vmware View Connection Server |
All Sessions
Description: Total numberof all View sessions active over the sampling period.
A Connection Server can sustain no more than 2000 active PCoIP sessions. This counter includes PCoIP as well as RDP connetions being brokered by this connection server.
View is typically licensed per concurrent user, with unlimited licenses for Connection and Security servers. If your active session count is high, add additional Connection or Security Servers
View supports up to 7 Connection Servers (5 actively serving users, 2 standby) per Pod.
Multiple Connection Servers must be load balanced using a support load balaning mechanism including DNS Round Robin, Network Load Balancing, or a software/hardware load balancing appliance.

Overall Counter Instance Statistics
| Overall statistics of each of the counter instances. Min, Avg, and Max are the minimum, average, and Maximum values in the entire log. Hourly Trend is the calculated hourly slope of the entire log. 10%, 20%, and 30% of Outliers Removed is the average of the values after the percentage of outliers furthest away from the average have been removed. This is to help determine if a small percentage of the values are extreme which can skew the average. |
| Condition | VMware VDMAll Sessions | Min | Avg | Max | Hourly Trend | Std Deviation | 10% of Outliers Removed | 20% of Outliers Removed | 30% of Outliers Removed |
|---|---|---|---|---|---|---|---|---|---|
| No Thresholds | VIEWCS1 | 1 | 1 | 1 | 0 | 0 | 1 | 1 | 1 |
Alerts
| An alert is generated if any of the thresholds were broken during one of the time ranges analyzed. The background of each of the values represents the highest priority threshold that the value broke. See each of the counter’s respective analysis section for more details about what the threshold means. |
| No Alerts Found |
|---|
All Sessions High
Description: Running count of the max number of sessions this View Connection Server has served at any one time. Verify that you have sufficient Connection and Security Servers to handle your peak AND to account for N+1 redundancy.

Overall Counter Instance Statistics
| Overall statistics of each of the counter instances. Min, Avg, and Max are the minimum, average, and Maximum values in the entire log. Hourly Trend is the calculated hourly slope of the entire log. 10%, 20%, and 30% of Outliers Removed is the average of the values after the percentage of outliers furthest away from the average have been removed. This is to help determine if a small percentage of the values are extreme which can skew the average. |
| Condition | VMware VDMAll Sessions High | Min | Avg | Max | Hourly Trend | Std Deviation | 10% of Outliers Removed | 20% of Outliers Removed | 30% of Outliers Removed |
|---|---|---|---|---|---|---|---|---|---|
| No Thresholds | VIEWCS1 | 1 | 1 | 1 | 0 | 0 | 1 | 1 | 1 |
Alerts
| An alert is generated if any of the thresholds were broken during one of the time ranges analyzed. The background of each of the values represents the highest priority threshold that the value broke. See each of the counter’s respective analysis section for more details about what the threshold means. |
| No Alerts Found |
|---|
Full VM Sessions
Description: Total number of Full VM sessions in use over the sampling period.

Overall Counter Instance Statistics
| Overall statistics of each of the counter instances. Min, Avg, and Max are the minimum, average, and Maximum values in the entire log. Hourly Trend is the calculated hourly slope of the entire log. 10%, 20%, and 30% of Outliers Removed is the average of the values after the percentage of outliers furthest away from the average have been removed. This is to help determine if a small percentage of the values are extreme which can skew the average. |
| Condition | VMware VDMFull VM Sessions | Min | Avg | Max | Hourly Trend | Std Deviation | 10% of Outliers Removed | 20% of Outliers Removed | 30% of Outliers Removed |
|---|---|---|---|---|---|---|---|---|---|
| No Thresholds | VIEWCS1 | 0 | 0 | 0 | 0 | 0 | 0 | 0 | 0 |
Alerts
| An alert is generated if any of the thresholds were broken during one of the time ranges analyzed. The background of each of the values represents the highest priority threshold that the value broke. See each of the counter’s respective analysis section for more details about what the threshold means. |
| No Alerts Found |
|---|
Full VM Sessions High
Description: Maximum number of Full VM sessions at any one time.

Overall Counter Instance Statistics
| Overall statistics of each of the counter instances. Min, Avg, and Max are the minimum, average, and Maximum values in the entire log. Hourly Trend is the calculated hourly slope of the entire log. 10%, 20%, and 30% of Outliers Removed is the average of the values after the percentage of outliers furthest away from the average have been removed. This is to help determine if a small percentage of the values are extreme which can skew the average. |
| Condition | VMware VDMFull VM Sessions High | Min | Avg | Max | Hourly Trend | Std Deviation | 10% of Outliers Removed | 20% of Outliers Removed | 30% of Outliers Removed |
|---|---|---|---|---|---|---|---|---|---|
| No Thresholds | VIEWCS1 | 0 | 0 | 0 | 0 | 0 | 0 | 0 | 0 |
Alerts
| An alert is generated if any of the thresholds were broken during one of the time ranges analyzed. The background of each of the values represents the highest priority threshold that the value broke. See each of the counter’s respective analysis section for more details about what the threshold means. |
| No Alerts Found |
|---|
Linked Clone Sessions
Description: Total number of Linked Clone sessions in use over the sampling period.

Overall Counter Instance Statistics
| Overall statistics of each of the counter instances. Min, Avg, and Max are the minimum, average, and Maximum values in the entire log. Hourly Trend is the calculated hourly slope of the entire log. 10%, 20%, and 30% of Outliers Removed is the average of the values after the percentage of outliers furthest away from the average have been removed. This is to help determine if a small percentage of the values are extreme which can skew the average. |
| Condition | VMware VDMLinked Clone Sessions | Min | Avg | Max | Hourly Trend | Std Deviation | 10% of Outliers Removed | 20% of Outliers Removed | 30% of Outliers Removed |
|---|---|---|---|---|---|---|---|---|---|
| No Thresholds | VIEWCS1 | 1 | 1 | 1 | 0 | 0 | 1 | 1 | 1 |
Alerts
| An alert is generated if any of the thresholds were broken during one of the time ranges analyzed. The background of each of the values represents the highest priority threshold that the value broke. See each of the counter’s respective analysis section for more details about what the threshold means. |
| No Alerts Found |
|---|
Linked Clone Sessions High
Description: Maximum number of Linked Clone sessions at any one time.

Overall Counter Instance Statistics
| Overall statistics of each of the counter instances. Min, Avg, and Max are the minimum, average, and Maximum values in the entire log. Hourly Trend is the calculated hourly slope of the entire log. 10%, 20%, and 30% of Outliers Removed is the average of the values after the percentage of outliers furthest away from the average have been removed. This is to help determine if a small percentage of the values are extreme which can skew the average. |
| Condition | VMware VDMLinked Clone Sessions High | Min | Avg | Max | Hourly Trend | Std Deviation | 10% of Outliers Removed | 20% of Outliers Removed | 30% of Outliers Removed |
|---|---|---|---|---|---|---|---|---|---|
| No Thresholds | VIEWCS1 | 1 | 1 | 1 | 0 | 0 | 1 | 1 | 1 |
Alerts
| An alert is generated if any of the thresholds were broken during one of the time ranges analyzed. The background of each of the values represents the highest priority threshold that the value broke. See each of the counter’s respective analysis section for more details about what the threshold means. |
| No Alerts Found |
|---|
Other Sessions
Description: Total number of other sessions in use over the sampling period, including admin, TS, etc..

Overall Counter Instance Statistics
| Overall statistics of each of the counter instances. Min, Avg, and Max are the minimum, average, and Maximum values in the entire log. Hourly Trend is the calculated hourly slope of the entire log. 10%, 20%, and 30% of Outliers Removed is the average of the values after the percentage of outliers furthest away from the average have been removed. This is to help determine if a small percentage of the values are extreme which can skew the average. |
| Condition | VMware VDMOther Sessions | Min | Avg | Max | Hourly Trend | Std Deviation | 10% of Outliers Removed | 20% of Outliers Removed | 30% of Outliers Removed |
|---|---|---|---|---|---|---|---|---|---|
| No Thresholds | VIEWCS1 | 0 | 0 | 0 | 0 | 0 | 0 | 0 | 0 |
Alerts
| An alert is generated if any of the thresholds were broken during one of the time ranges analyzed. The background of each of the values represents the highest priority threshold that the value broke. See each of the counter’s respective analysis section for more details about what the threshold means. |
| No Alerts Found |
|---|
Other Sessions High
Description: Maximum number of other sessions in use any any one time, including admin, TS, etc..

Overall Counter Instance Statistics
| Overall statistics of each of the counter instances. Min, Avg, and Max are the minimum, average, and Maximum values in the entire log. Hourly Trend is the calculated hourly slope of the entire log. 10%, 20%, and 30% of Outliers Removed is the average of the values after the percentage of outliers furthest away from the average have been removed. This is to help determine if a small percentage of the values are extreme which can skew the average. |
| Condition | VMware VDMOther Sessions High | Min | Avg | Max | Hourly Trend | Std Deviation | 10% of Outliers Removed | 20% of Outliers Removed | 30% of Outliers Removed |
|---|---|---|---|---|---|---|---|---|---|
| No Thresholds | VIEWCS1 | 0 | 0 | 0 | 0 | 0 | 0 | 0 | 0 |
Alerts
| An alert is generated if any of the thresholds were broken during one of the time ranges analyzed. The background of each of the values represents the highest priority threshold that the value broke. See each of the counter’s respective analysis section for more details about what the threshold means. |
| No Alerts Found |
|---|
PCoIP Gateway Sessions
Description: Total number of PCoIP gateway sessions that are currently open.

Overall Counter Instance Statistics
| Overall statistics of each of the counter instances. Min, Avg, and Max are the minimum, average, and Maximum values in the entire log. Hourly Trend is the calculated hourly slope of the entire log. 10%, 20%, and 30% of Outliers Removed is the average of the values after the percentage of outliers furthest away from the average have been removed. This is to help determine if a small percentage of the values are extreme which can skew the average. |
| Condition | VMware VDMPCoIP Gateway Sessions | Min | Avg | Max | Hourly Trend | Std Deviation | 10% of Outliers Removed | 20% of Outliers Removed | 30% of Outliers Removed |
|---|---|---|---|---|---|---|---|---|---|
| No Thresholds | VIEWCS1 | 0 | 0 | 0 | 0 | 0 | 0 | 0 | 0 |
Alerts
| An alert is generated if any of the thresholds were broken during one of the time ranges analyzed. The background of each of the values represents the highest priority threshold that the value broke. See each of the counter’s respective analysis section for more details about what the threshold means. |
| No Alerts Found |
|---|
PCoIP Gateway Sessions High
Description: An incrementing number that represents the total number of PCoIP gateway sessions that have been open at any one time

Overall Counter Instance Statistics
| Overall statistics of each of the counter instances. Min, Avg, and Max are the minimum, average, and Maximum values in the entire log. Hourly Trend is the calculated hourly slope of the entire log. 10%, 20%, and 30% of Outliers Removed is the average of the values after the percentage of outliers furthest away from the average have been removed. This is to help determine if a small percentage of the values are extreme which can skew the average. |
| Condition | VMware VDMPCoIP Gateway Sessions High | Min | Avg | Max | Hourly Trend | Std Deviation | 10% of Outliers Removed | 20% of Outliers Removed | 30% of Outliers Removed |
|---|---|---|---|---|---|---|---|---|---|
| No Thresholds | VIEWCS1 | 0 | 0 | 0 | 0 | 0 | 0 | 0 | 0 |
Alerts
| An alert is generated if any of the thresholds were broken during one of the time ranges analyzed. The background of each of the values represents the highest priority threshold that the value broke. See each of the counter’s respective analysis section for more details about what the threshold means. |
| No Alerts Found |
|---|
Secure Gateway Sessions
Description: Total number of Secure Gateway sessions that are currently open.

Overall Counter Instance Statistics
| Overall statistics of each of the counter instances. Min, Avg, and Max are the minimum, average, and Maximum values in the entire log. Hourly Trend is the calculated hourly slope of the entire log. 10%, 20%, and 30% of Outliers Removed is the average of the values after the percentage of outliers furthest away from the average have been removed. This is to help determine if a small percentage of the values are extreme which can skew the average. |
| Condition | VMware VDMSecure Gateway Sessions | Min | Avg | Max | Hourly Trend | Std Deviation | 10% of Outliers Removed | 20% of Outliers Removed | 30% of Outliers Removed |
|---|---|---|---|---|---|---|---|---|---|
| No Thresholds | VIEWCS1 | 0 | 0 | 0 | 0 | 0 | 0 | 0 | 0 |
Alerts
| An alert is generated if any of the thresholds were broken during one of the time ranges analyzed. The background of each of the values represents the highest priority threshold that the value broke. See each of the counter’s respective analysis section for more details about what the threshold means. |
| No Alerts Found |
|---|
Secure Gateway Sessions High
Description: An incrementing number that represents the total number of Secure Gateway sessions that have been open at any one time

Overall Counter Instance Statistics
| Overall statistics of each of the counter instances. Min, Avg, and Max are the minimum, average, and Maximum values in the entire log. Hourly Trend is the calculated hourly slope of the entire log. 10%, 20%, and 30% of Outliers Removed is the average of the values after the percentage of outliers furthest away from the average have been removed. This is to help determine if a small percentage of the values are extreme which can skew the average. |
| Condition | VMware VDMSecure Gateway Sessions High | Min | Avg | Max | Hourly Trend | Std Deviation | 10% of Outliers Removed | 20% of Outliers Removed | 30% of Outliers Removed |
|---|---|---|---|---|---|---|---|---|---|
| No Thresholds | VIEWCS1 | 0 | 0 | 0 | 0 | 0 | 0 | 0 | 0 |
Alerts
| An alert is generated if any of the thresholds were broken during one of the time ranges analyzed. The background of each of the values represents the highest priority threshold that the value broke. See each of the counter’s respective analysis section for more details about what the threshold means. |
| No Alerts Found |
|---|
VMware View Connection Server |
All Sessions
Description: Total numberof all View sessions active over the sampling period.
A Connection Server can sustain no more than 2000 active PCoIP sessions. This counter includes PCoIP as well as RDP connetions being brokered by this connection server.
View is typically licensed per concurrent user, with unlimited licenses for Connection and Security servers. If your active session count is high, add additional Connection or Security Servers
View supports up to 7 Connection Servers (5 actively serving users, 2 standby) per Pod.
Multiple Connection Servers must be load balanced using a support load balaning mechanism including DNS Round Robin, Network Load Balancing, or a software/hardware load balancing appliance.
Overall Counter Instance Statistics
| Overall statistics of each of the counter instances. Min, Avg, and Max are the minimum, average, and Maximum values in the entire log. Hourly Trend is the calculated hourly slope of the entire log. 10%, 20%, and 30% of Outliers Removed is the average of the values after the percentage of outliers furthest away from the average have been removed. This is to help determine if a small percentage of the values are extreme which can skew the average. |
| Condition | VMware VDMAll Sessions | Min | Avg | Max | Hourly Trend | Std Deviation | 10% of Outliers Removed | 20% of Outliers Removed | 30% of Outliers Removed |
|---|---|---|---|---|---|---|---|---|---|
| No Thresholds | VIEWCS1 | 1 | 1 | 1 | 0 | 0 | 1 | 1 | 1 |
Alerts
| An alert is generated if any of the thresholds were broken during one of the time ranges analyzed. The background of each of the values represents the highest priority threshold that the value broke. See each of the counter’s respective analysis section for more details about what the threshold means. |
| No Alerts Found |
|---|
All Sessions High
Description: Running count of the max number of sessions this View Connection Server has served at any one time. Verify that you have sufficient Connection and Security Servers to handle your peak AND to account for N+1 redundancy.
Overall Counter Instance Statistics
| Overall statistics of each of the counter instances. Min, Avg, and Max are the minimum, average, and Maximum values in the entire log. Hourly Trend is the calculated hourly slope of the entire log. 10%, 20%, and 30% of Outliers Removed is the average of the values after the percentage of outliers furthest away from the average have been removed. This is to help determine if a small percentage of the values are extreme which can skew the average. |
| Condition | VMware VDMAll Sessions High | Min | Avg | Max | Hourly Trend | Std Deviation | 10% of Outliers Removed | 20% of Outliers Removed | 30% of Outliers Removed |
|---|---|---|---|---|---|---|---|---|---|
| No Thresholds | VIEWCS1 | 1 | 1 | 1 | 0 | 0 | 1 | 1 | 1 |
Alerts
| An alert is generated if any of the thresholds were broken during one of the time ranges analyzed. The background of each of the values represents the highest priority threshold that the value broke. See each of the counter’s respective analysis section for more details about what the threshold means. |
| No Alerts Found |
|---|
Full VM Sessions
Description: Total number of Full VM sessions in use over the sampling period.
Overall Counter Instance Statistics
| Overall statistics of each of the counter instances. Min, Avg, and Max are the minimum, average, and Maximum values in the entire log. Hourly Trend is the calculated hourly slope of the entire log. 10%, 20%, and 30% of Outliers Removed is the average of the values after the percentage of outliers furthest away from the average have been removed. This is to help determine if a small percentage of the values are extreme which can skew the average. |
| Condition | VMware VDMFull VM Sessions | Min | Avg | Max | Hourly Trend | Std Deviation | 10% of Outliers Removed | 20% of Outliers Removed | 30% of Outliers Removed |
|---|---|---|---|---|---|---|---|---|---|
| No Thresholds | VIEWCS1 | 0 | 0 | 0 | 0 | 0 | 0 | 0 | 0 |
Alerts
| An alert is generated if any of the thresholds were broken during one of the time ranges analyzed. The background of each of the values represents the highest priority threshold that the value broke. See each of the counter’s respective analysis section for more details about what the threshold means. |
| No Alerts Found |
|---|
Full VM Sessions High
Description: Maximum number of Full VM sessions at any one time.
Overall Counter Instance Statistics
| Overall statistics of each of the counter instances. Min, Avg, and Max are the minimum, average, and Maximum values in the entire log. Hourly Trend is the calculated hourly slope of the entire log. 10%, 20%, and 30% of Outliers Removed is the average of the values after the percentage of outliers furthest away from the average have been removed. This is to help determine if a small percentage of the values are extreme which can skew the average. |
| Condition | VMware VDMFull VM Sessions High | Min | Avg | Max | Hourly Trend | Std Deviation | 10% of Outliers Removed | 20% of Outliers Removed | 30% of Outliers Removed |
|---|---|---|---|---|---|---|---|---|---|
| No Thresholds | VIEWCS1 | 0 | 0 | 0 | 0 | 0 | 0 | 0 | 0 |
Alerts
| An alert is generated if any of the thresholds were broken during one of the time ranges analyzed. The background of each of the values represents the highest priority threshold that the value broke. See each of the counter’s respective analysis section for more details about what the threshold means. |
| No Alerts Found |
|---|
Linked Clone Sessions
Description: Total number of Linked Clone sessions in use over the sampling period.
Overall Counter Instance Statistics
| Overall statistics of each of the counter instances. Min, Avg, and Max are the minimum, average, and Maximum values in the entire log. Hourly Trend is the calculated hourly slope of the entire log. 10%, 20%, and 30% of Outliers Removed is the average of the values after the percentage of outliers furthest away from the average have been removed. This is to help determine if a small percentage of the values are extreme which can skew the average. |
| Condition | VMware VDMLinked Clone Sessions | Min | Avg | Max | Hourly Trend | Std Deviation | 10% of Outliers Removed | 20% of Outliers Removed | 30% of Outliers Removed |
|---|---|---|---|---|---|---|---|---|---|
| No Thresholds | VIEWCS1 | 1 | 1 | 1 | 0 | 0 | 1 | 1 | 1 |
Alerts
| An alert is generated if any of the thresholds were broken during one of the time ranges analyzed. The background of each of the values represents the highest priority threshold that the value broke. See each of the counter’s respective analysis section for more details about what the threshold means. |
| No Alerts Found |
|---|
Linked Clone Sessions High
Description: Maximum number of Linked Clone sessions at any one time.
Overall Counter Instance Statistics
| Overall statistics of each of the counter instances. Min, Avg, and Max are the minimum, average, and Maximum values in the entire log. Hourly Trend is the calculated hourly slope of the entire log. 10%, 20%, and 30% of Outliers Removed is the average of the values after the percentage of outliers furthest away from the average have been removed. This is to help determine if a small percentage of the values are extreme which can skew the average. |
| Condition | VMware VDMLinked Clone Sessions High | Min | Avg | Max | Hourly Trend | Std Deviation | 10% of Outliers Removed | 20% of Outliers Removed | 30% of Outliers Removed |
|---|---|---|---|---|---|---|---|---|---|
| No Thresholds | VIEWCS1 | 1 | 1 | 1 | 0 | 0 | 1 | 1 | 1 |
Alerts
| An alert is generated if any of the thresholds were broken during one of the time ranges analyzed. The background of each of the values represents the highest priority threshold that the value broke. See each of the counter’s respective analysis section for more details about what the threshold means. |
| No Alerts Found |
|---|
Other Sessions
Description: Total number of other sessions in use over the sampling period, including admin, TS, etc..
Overall Counter Instance Statistics
| Overall statistics of each of the counter instances. Min, Avg, and Max are the minimum, average, and Maximum values in the entire log. Hourly Trend is the calculated hourly slope of the entire log. 10%, 20%, and 30% of Outliers Removed is the average of the values after the percentage of outliers furthest away from the average have been removed. This is to help determine if a small percentage of the values are extreme which can skew the average. |
| Condition | VMware VDMOther Sessions | Min | Avg | Max | Hourly Trend | Std Deviation | 10% of Outliers Removed | 20% of Outliers Removed | 30% of Outliers Removed |
|---|---|---|---|---|---|---|---|---|---|
| No Thresholds | VIEWCS1 | 0 | 0 | 0 | 0 | 0 | 0 | 0 | 0 |
Alerts
| An alert is generated if any of the thresholds were broken during one of the time ranges analyzed. The background of each of the values represents the highest priority threshold that the value broke. See each of the counter’s respective analysis section for more details about what the threshold means. |
| No Alerts Found |
|---|
Other Sessions High
Description: Maximum number of other sessions in use any any one time, including admin, TS, etc..
Overall Counter Instance Statistics
| Overall statistics of each of the counter instances. Min, Avg, and Max are the minimum, average, and Maximum values in the entire log. Hourly Trend is the calculated hourly slope of the entire log. 10%, 20%, and 30% of Outliers Removed is the average of the values after the percentage of outliers furthest away from the average have been removed. This is to help determine if a small percentage of the values are extreme which can skew the average. |
| Condition | VMware VDMOther Sessions High | Min | Avg | Max | Hourly Trend | Std Deviation | 10% of Outliers Removed | 20% of Outliers Removed | 30% of Outliers Removed |
|---|---|---|---|---|---|---|---|---|---|
| No Thresholds | VIEWCS1 | 0 | 0 | 0 | 0 | 0 | 0 | 0 | 0 |
Alerts
| An alert is generated if any of the thresholds were broken during one of the time ranges analyzed. The background of each of the values represents the highest priority threshold that the value broke. See each of the counter’s respective analysis section for more details about what the threshold means. |
| No Alerts Found |
|---|
PCoIP Gateway Sessions
Description: Total number of PCoIP gateway sessions that are currently open.
Overall Counter Instance Statistics
| Overall statistics of each of the counter instances. Min, Avg, and Max are the minimum, average, and Maximum values in the entire log. Hourly Trend is the calculated hourly slope of the entire log. 10%, 20%, and 30% of Outliers Removed is the average of the values after the percentage of outliers furthest away from the average have been removed. This is to help determine if a small percentage of the values are extreme which can skew the average. |
| Condition | VMware VDMPCoIP Gateway Sessions | Min | Avg | Max | Hourly Trend | Std Deviation | 10% of Outliers Removed | 20% of Outliers Removed | 30% of Outliers Removed |
|---|---|---|---|---|---|---|---|---|---|
| No Thresholds | VIEWCS1 | 0 | 0 | 0 | 0 | 0 | 0 | 0 | 0 |
Alerts
| An alert is generated if any of the thresholds were broken during one of the time ranges analyzed. The background of each of the values represents the highest priority threshold that the value broke. See each of the counter’s respective analysis section for more details about what the threshold means. |
| No Alerts Found |
|---|
PCoIP Gateway Sessions High
Description: An incrementing number that represents the total number of PCoIP gateway sessions that have been open at any one time
Overall Counter Instance Statistics
| Overall statistics of each of the counter instances. Min, Avg, and Max are the minimum, average, and Maximum values in the entire log. Hourly Trend is the calculated hourly slope of the entire log. 10%, 20%, and 30% of Outliers Removed is the average of the values after the percentage of outliers furthest away from the average have been removed. This is to help determine if a small percentage of the values are extreme which can skew the average. |
| Condition | VMware VDMPCoIP Gateway Sessions High | Min | Avg | Max | Hourly Trend | Std Deviation | 10% of Outliers Removed | 20% of Outliers Removed | 30% of Outliers Removed |
|---|---|---|---|---|---|---|---|---|---|
| No Thresholds | VIEWCS1 | 0 | 0 | 0 | 0 | 0 | 0 | 0 | 0 |
Alerts
| An alert is generated if any of the thresholds were broken during one of the time ranges analyzed. The background of each of the values represents the highest priority threshold that the value broke. See each of the counter’s respective analysis section for more details about what the threshold means. |
| No Alerts Found |
|---|
Secure Gateway Sessions
Description: Total number of Secure Gateway sessions that are currently open.
Overall Counter Instance Statistics
| Overall statistics of each of the counter instances. Min, Avg, and Max are the minimum, average, and Maximum values in the entire log. Hourly Trend is the calculated hourly slope of the entire log. 10%, 20%, and 30% of Outliers Removed is the average of the values after the percentage of outliers furthest away from the average have been removed. This is to help determine if a small percentage of the values are extreme which can skew the average. |
| Condition | VMware VDMSecure Gateway Sessions | Min | Avg | Max | Hourly Trend | Std Deviation | 10% of Outliers Removed | 20% of Outliers Removed | 30% of Outliers Removed |
|---|---|---|---|---|---|---|---|---|---|
| No Thresholds | VIEWCS1 | 0 | 0 | 0 | 0 | 0 | 0 | 0 | 0 |
Alerts
| An alert is generated if any of the thresholds were broken during one of the time ranges analyzed. The background of each of the values represents the highest priority threshold that the value broke. See each of the counter’s respective analysis section for more details about what the threshold means. |
| No Alerts Found |
|---|
Secure Gateway Sessions High
Description: An incrementing number that represents the total number of Secure Gateway sessions that have been open at any one time
Overall Counter Instance Statistics
| Overall statistics of each of the counter instances. Min, Avg, and Max are the minimum, average, and Maximum values in the entire log. Hourly Trend is the calculated hourly slope of the entire log. 10%, 20%, and 30% of Outliers Removed is the average of the values after the percentage of outliers furthest away from the average have been removed. This is to help determine if a small percentage of the values are extreme which can skew the average. |
| Condition | VMware VDMSecure Gateway Sessions High | Min | Avg | Max | Hourly Trend | Std Deviation | 10% of Outliers Removed | 20% of Outliers Removed | 30% of Outliers Removed |
|---|---|---|---|---|---|---|---|---|---|
| No Thresholds | VIEWCS1 | 0 | 0 | 0 | 0 | 0 | 0 | 0 | 0 |
Alerts
| An alert is generated if any of the thresholds were broken during one of the time ranges analyzed. The background of each of the values represents the highest priority threshold that the value broke. See each of the counter’s respective analysis section for more details about what the threshold means. |
| No Alerts Found |
|---|
[…] View PAL Connection Server Sample Report […]